Chart | Swath Plot
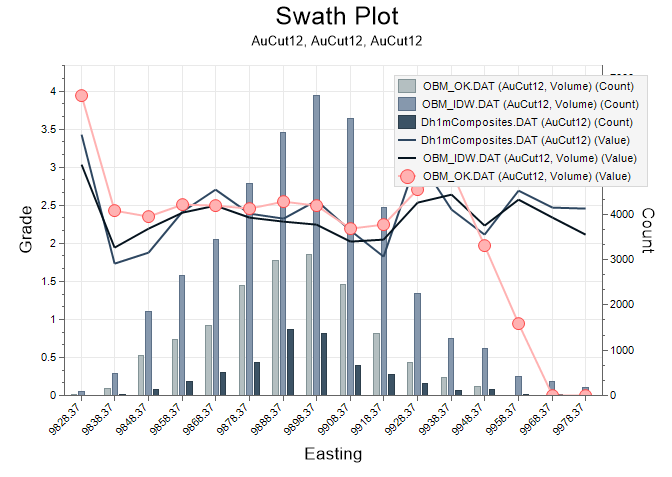
The Swath Plot provides a spatial summary of any combination of data by showing the trend of vertical or horizontal slices (or swaths).
Swath plots are often used to validate resource estimation by comparing swath plots of original assays against a block model.
When you generate a chart, many tools and options are common to most charts. See: Chart Tools
Tools on the Chart | Swath Plot tab, in the Swath Plot group, allow you to:
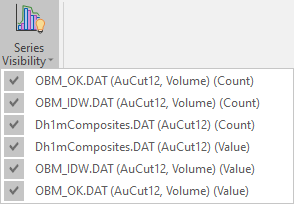
- Show or hide one or more swaths in the series so that specific swaths can be viewed:
![]()