Chart | Shewart
In the Chart Display, you can view and analyse the Control chart. Tools are available which allow you to highlight the corresponding data in Vizex and the File Editor.
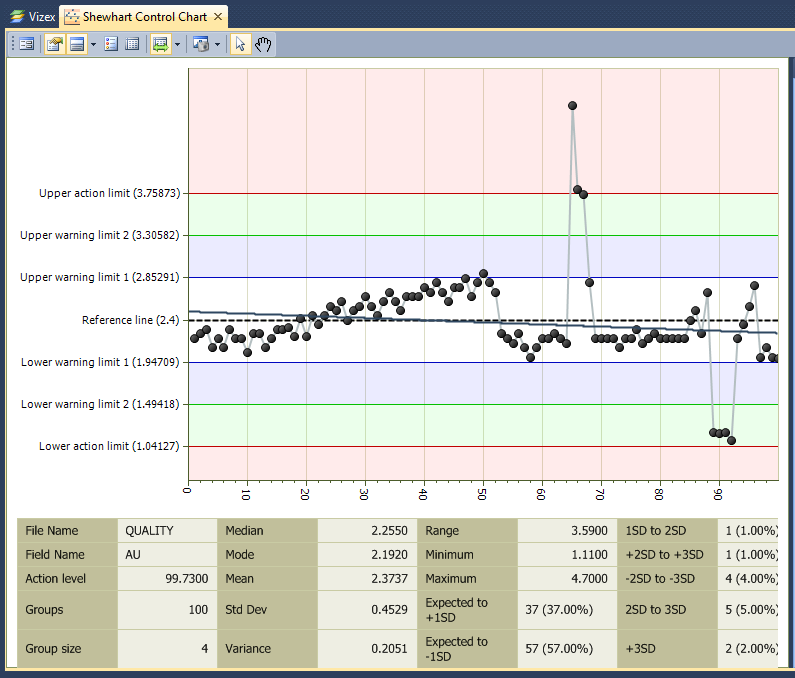
Information about the chart is displayed in the Properties Table on the chart itself (if you select the Show Properties Table option on the Chart | Shewart Chart tab).
![]()
When you generate a chart, many tools and options are common to most charts. See: Chart Tools