Report Generator
![]()
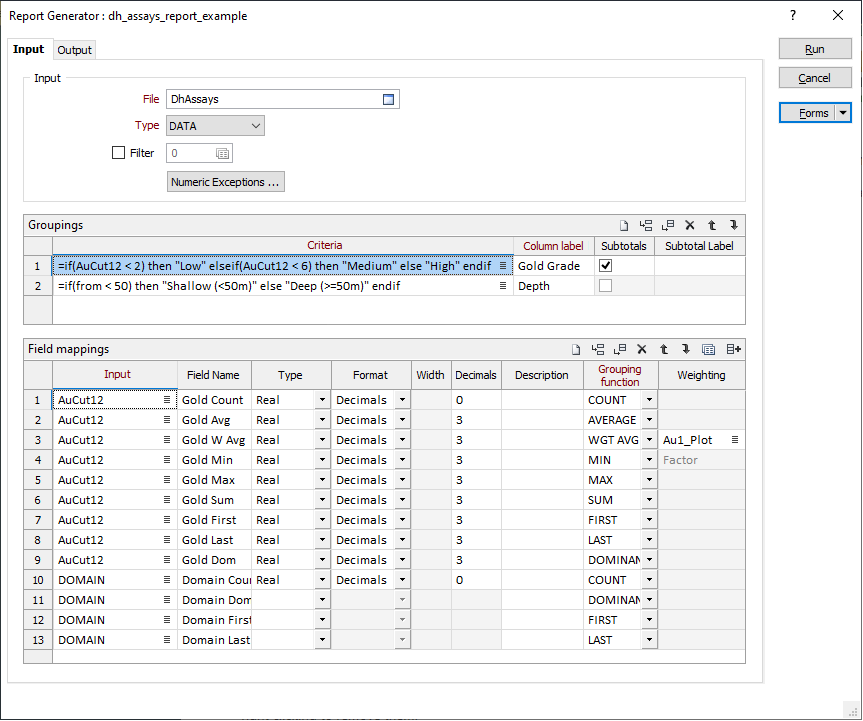
When you use the Report Generator to generate a report, the fields in the input file can be reformatted and re-sequenced before being written to the report. New fields can be created, or be derived using complex expressions, and added to the report. The report data can be grouped, based on the criteria you specify, and aggregated using various methods.
Input
File
Select a file type and double-click (or click on the Select icon) to select the name of the Input file.
Select the filter check box to define a filter to selectively control which records will be processed. Enter a filter number in the adjacent response. Double click (F3) to see a list of existing filters. Right click (F4) to open the dialog box where you can create a new filter.
Numeric Exceptions
(Optional) Use the Numeric Exceptions group to control the way that non-numeric values are handled. Non-numeric values include characters, blanks, and values preceded by a less than sign (<).
Groupings
The Groupings grid lets you specify criteria that separates the data aggregation into groups. For example, if you have a Lithology field that lists different rock types, you can select that field to obtain the aggregated data in separate entries per rock type.
Criteria
You can also use expressions to create groups from arbitrary criteria. For example, the following input expression would generate three groups: "Low", "Medium" and "High", depending on the number in the AuCut12 field:
=if(AuCut12 < 2) then "Low" elseif(AuCut12 < 6) then "Medium" else "High" endif
Note: To customise the sorting order of grouped entries, a sort order can be specified in the grouping expression itself. See: Sort Order
Column Label
This option decides the column title of this group. In the example of the AuCut12 expression group you might want the label "Gold Grade".
Subtotals
If this option is checked, the report generator will generate columns where each group ends and fill these with the sub-aggregations of that group only. In the following example, a Gold Grade group is given subtotals:
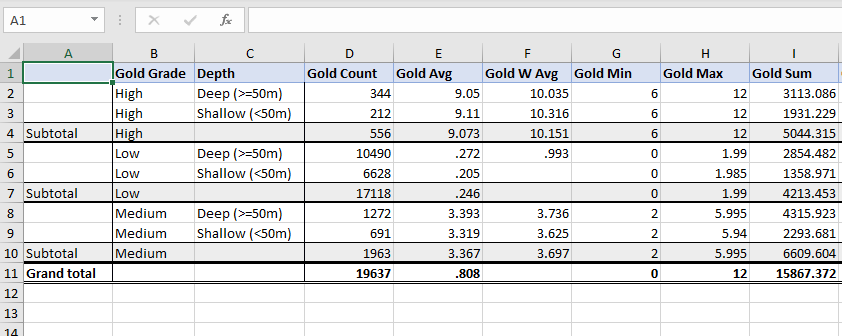
In the Excel report, these are marked as grey columns. If several groups are ticked, then they will have subtotals in a hierarchy with the top-most group being the most significant group in the hierarchy.
Subtotal label
Optionally enter a label for each subtotal. The label defaults to "Subtotal" but could be given a more specific name, "Rock type subtotals" for example.
Field Mappings
Use the Fields Mappings grid to setup the fields to be read/derived from the input file for transformation/copying to the output file. Use the buttons on the grid list toolbar to Manage the rows in the list.
The grid list accepts the following settings for each field:
Input
A field from the Input file. (An Auto-fill option on the toolbar can be used to populate the grid with all the fields in the input file.)
The input field may also be a complex expression which evaluates as a character string, for example:
=if ([au] >5) then "HIGH GRADE" elif "LOW GRADE" endif"
Field Name
The output field name. If this entry is left blank and the entry for the input field is not an expression, the input field name is used.
Type
The output field type. If this entry is left blank and the entry for the input field is not an expression, the type of the input field is used.
Format
The format options you can select for a field will depend on the type of field. For more information, see: Format
Width
For Character and Numeric fields, specify the width of the field.
Decimals
For Numeric fields, and Real or Float binary fields, the number of decimal places.
Description
Allows the purpose and the content of a field to be described using a maximum of 255 characters.
Grouping Function
Choose how each field will be grouped in the report. WGT AVG (VOLUME) is the default for Real or Float fields. DOMINANT is the default for Character fields.
Weighting
When the Custom Weighting grouping function is selected, either the name of the weighting field, or a complex expression.