Plan View
Plan views are configured under the Drillhole Utilities | Plan Views node of the Configuration Manager. Once they are configured, they can be added to a profile.
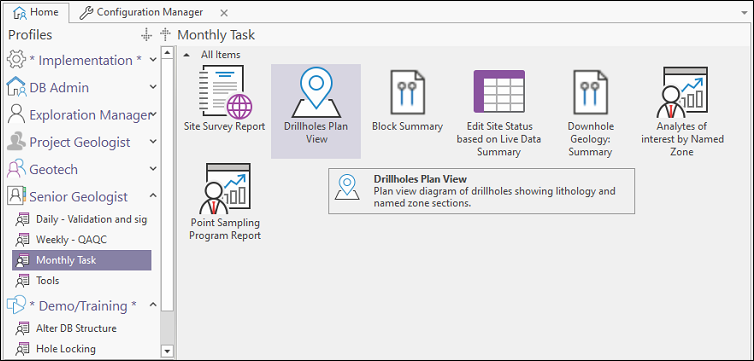
To execute a plan view, right-click on the plan view object and select Execute from the right-click menu.
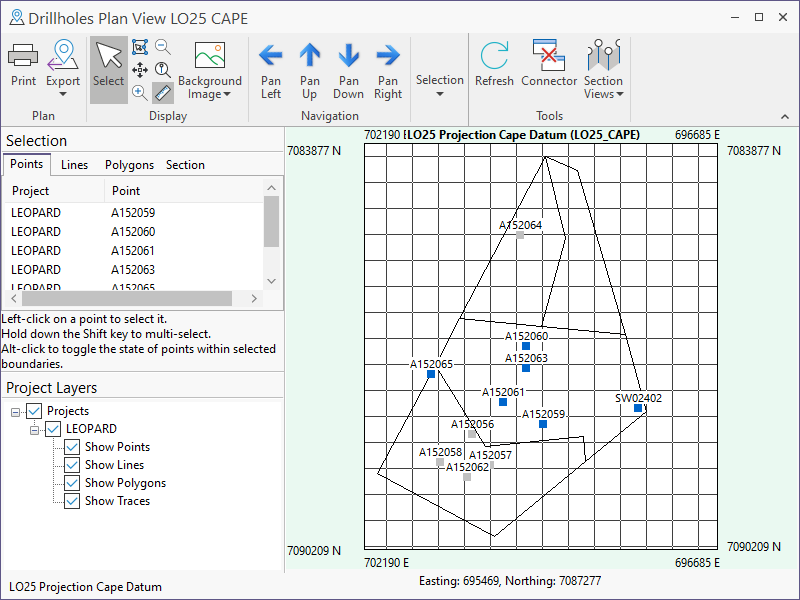
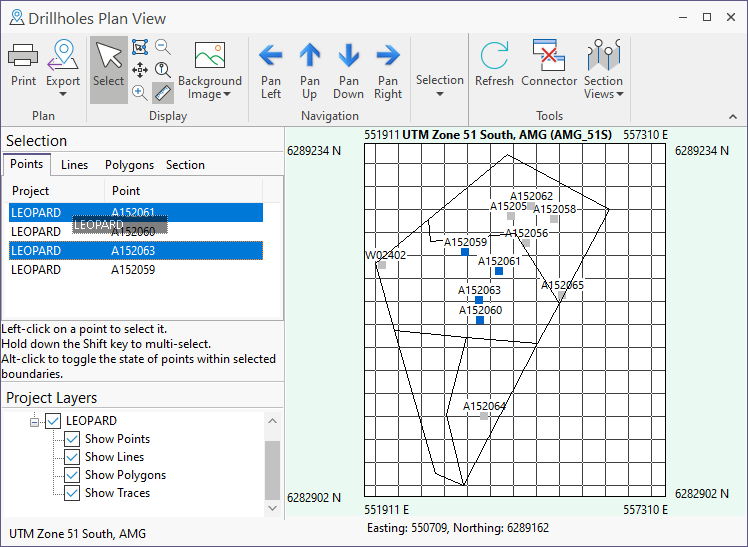
The Plan View provides a visual representation of the point, boundary, and section data for a project, or across multiple projects. If the data from more than one project is retrieved, the first project you select determines the coordinate system that will be used for the display.
Point and boundary data is automatically converted to a common, nominated coordinate system prior to viewing. Pit outlines surveyed on a local grid, for example, can be quickly and easily displayed alongside drillholes surveyed in UTM.
The display grid is based on the maximum extent (easting / northing or longitude / latitude) of the points / lines in the plan view. The application determines which has the least range (i.e. either easting or northing, or longitude or latitude) depending on the coordinate system, and the number of increments is calculated by dividing that range by 10.
You will notice when the Plan View is displayed, there will be 10 lines between extents of the shortest range.
Data import, export and selection Tools, section view and report connectivity tools, are provided on a local toolbar.
The Plan View can be used in three ways:
- As a validation tool. By viewing your data spatially, anomalies in your data, such as incorrectly entered coordinates, are more easily identified.
- As a connectivity tool. Provided that Find parameters have been set up for a graphic report, the plan view can be used to spatially select a hole, a line, or a polygon boundary that will be queried in a graphic report.
- As a select tool. The plan view can be synced with the Site List Editor and be used to spatially select the holes that will be included or excluded from a site list. Conversely, the Site List can be used to change the hole selection in the Plan View.
Point, line, and polygon layers can be manipulated in the Plan View:
Points
Left-click on a point to select it. Hold down the SHIFT key to multi-select. You can also click and drag the mouse to select the points within a selection rectangle, or select the points within a boundary on the Polygons tab.
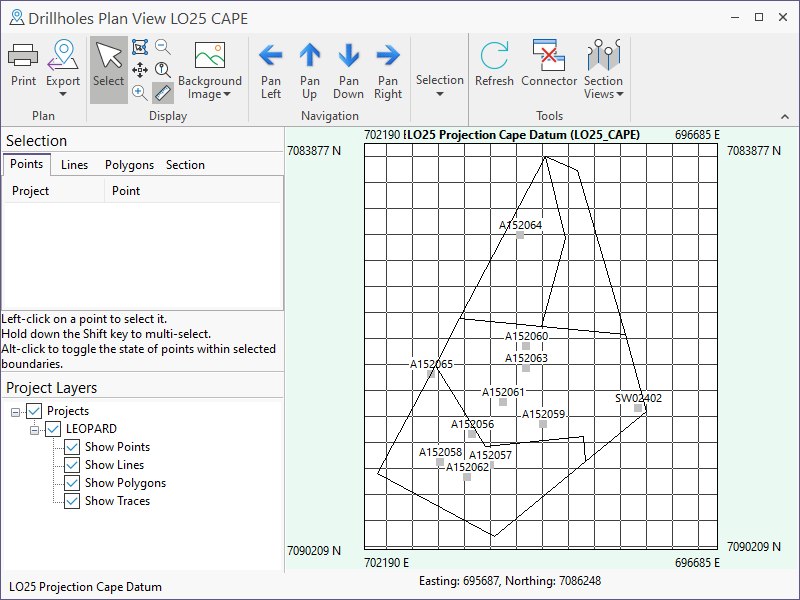
Note: To completely clear the list of selected points, in Points mode (select the Points tab), click on any white space in the Plan View.
Lines
Left-click on a line to select it. Hold down the SHIFT key to multi-select.
Polygons
For polygons, left-click within a boundary to select it. Hold down the SHIFT key to multi-select.
Use ALT to toggle the state of all points within a boundary.
Use CTRL to deal with overlapping or obscured boundaries.
Traces
Left-click on a drillhole trace to select it. Hold down the SHIFT key to multi-select.
Section
To view a section:
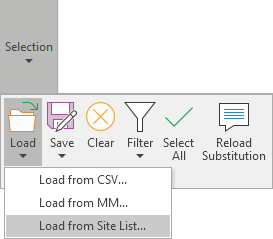
- Click on the Section tab.
- Select the successive drillholes that you want to display in section, Alternatively, select Load from Site List... to load a previously saved site list.
- You can temporarily redefine the sequence of the holes by clicking and dragging to change the order of the holes in the Section pane:
See the note: Site List Sequencing (below)
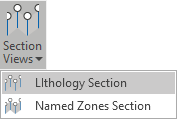
- Select an option from the Section Views tool menu. When you select one or more columns, those columns are displayed in the Section View.
Multiple columns can be configured per section view on the Configuration | Sections page of the Plan View Property Editor.
Site List Sequencing
Note: In the case of a linked Site List Editor and Plan View, when you change the sequence in Plan View Section mode, this will create a temporary change. To restore the saved sequence set in the Site List, simply refresh the Site List. To create a permanent change to the Site List sequence; adjust the sequence in the Site List and then save the Site List.