Conformance
Review site conformance in the Conformance tab.
-
Benches panel (left): shows the highlighted pit or bench.
-
Layers and Surfaces (top right): toggles layers and surfaces display.
-
Domain legend (bottom right): shows the color-coding for each conformance type.
-
Viewport (center): shows the 3D conformance solids.
-
Information tabs (Cross-Section, Reserves, Report, Waterfall) (bottom): show charts, scores and reserves for the highlighted pit or bench.
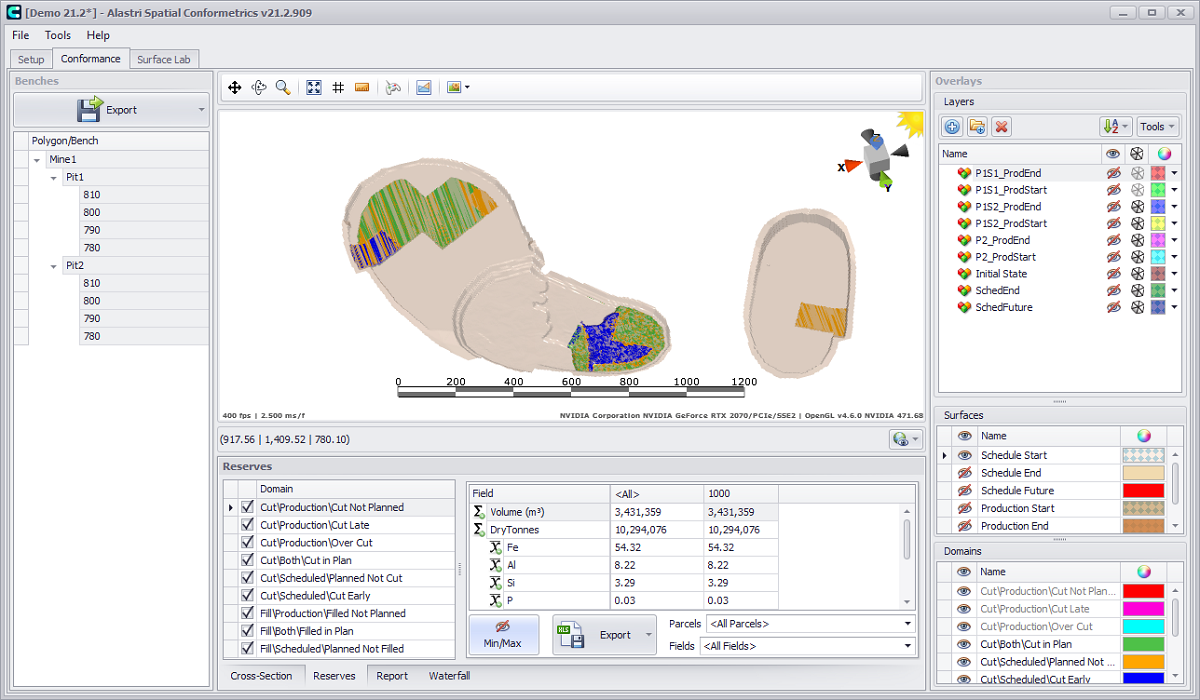
Conformance tab overview
Full description of all each Conformance tab item, as well as their features and interaction ways see in the section Conformance tab section.
In this section Reporting and Exporting functions are explained in details.
Reserves tab
Click in the Reserves panel to compare the production and scheduled reserves.
-
Use the tick boxes to show and hide reserves for different components.
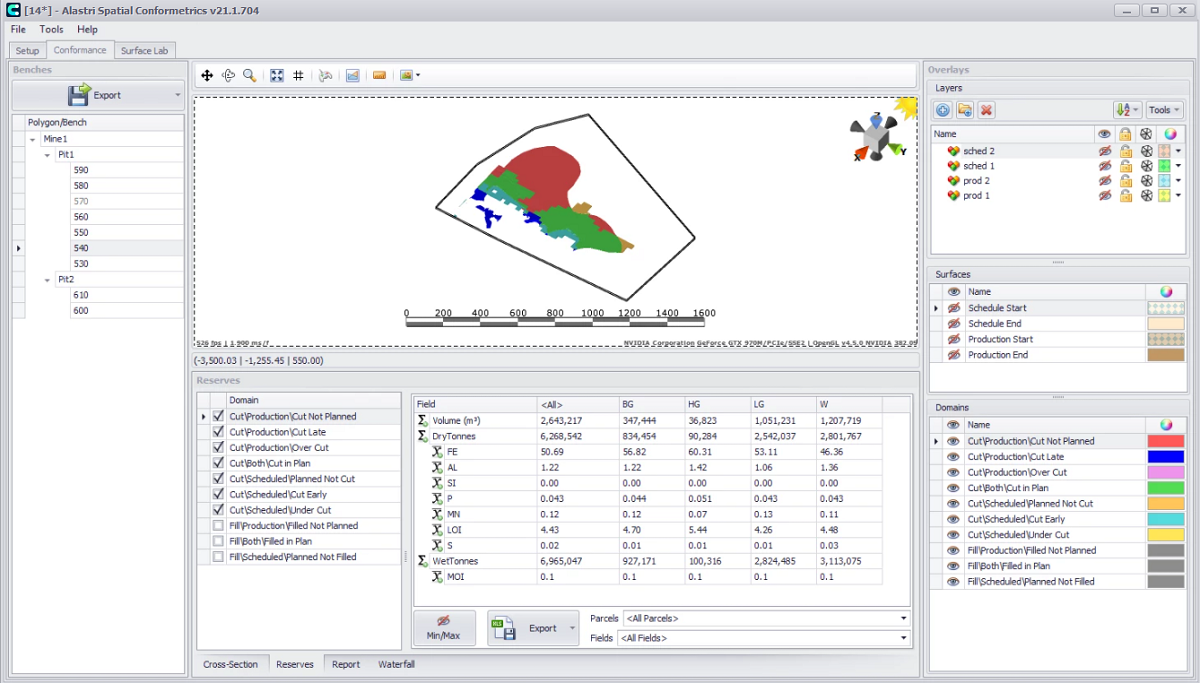
Reserves for Pit1 540RL
More details see Reserves tab.
Cross-Section tab
Click in the Cross-Section panel to view cutaways of the conformance solids.
-
Click the cross-section icon to begin.
-
Click and drag on screen to define the breadth and bearing of the section plane.
-
Zoom, pan and vertically exaggerate the view inside the Cross-Section panel.
-
Step forward and backward with the up/down arrow icons in the Cross-Section panel.
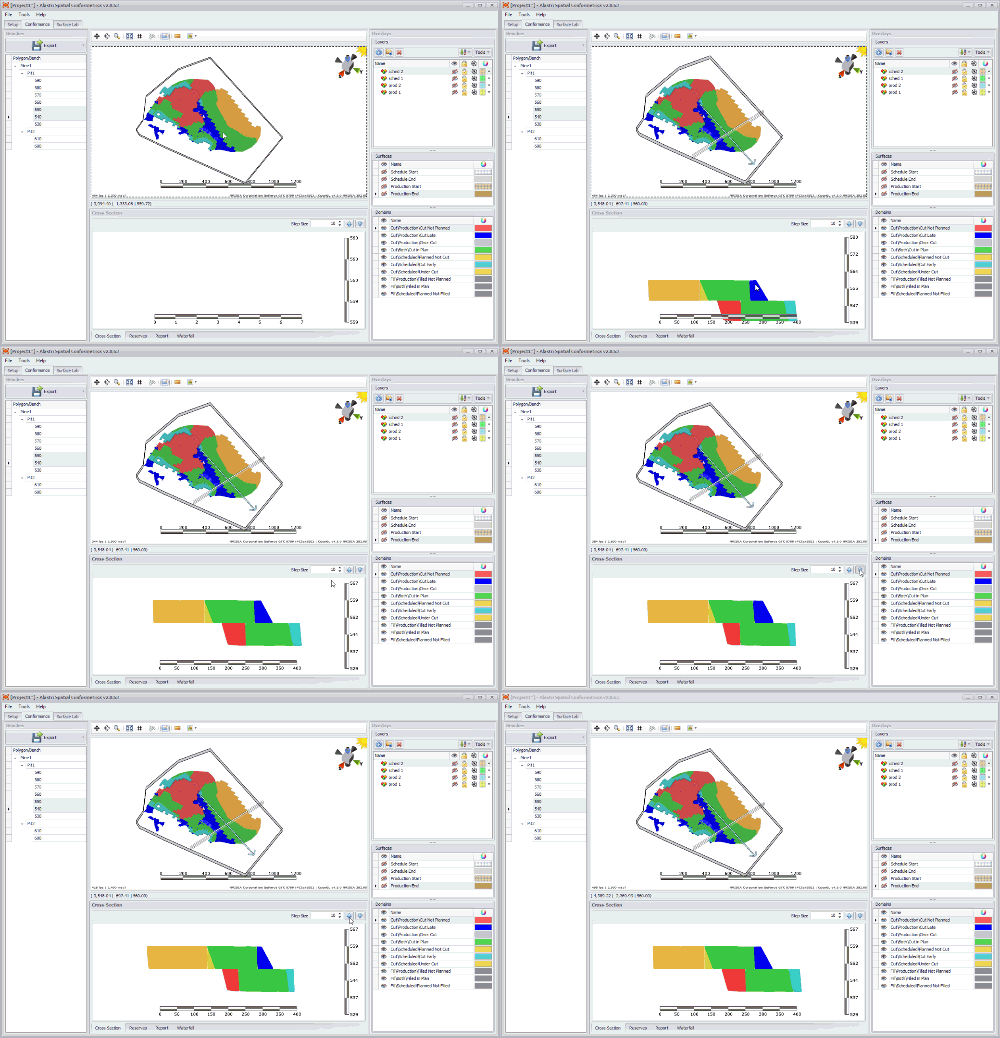
Cross section of Pit1 540-560 RL
Waterfall tab
Open the Waterfall tab to see the conformance chart.
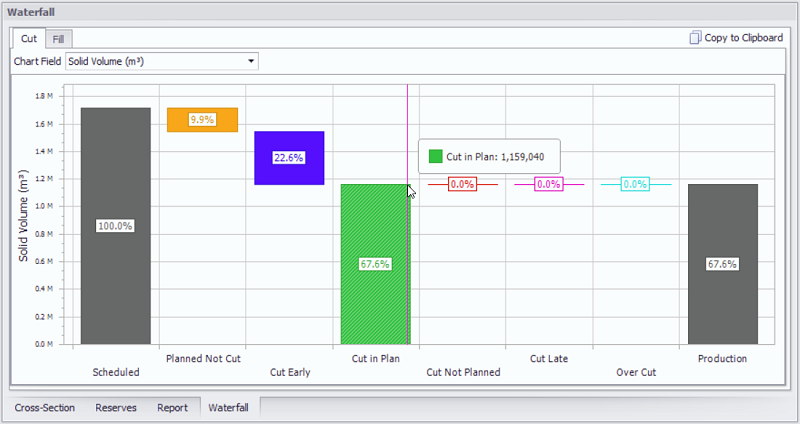
Review conformance chart in the Waterfall tab
-
Select polygon/bench from Benches panel in order to display a chart for it. You can select single RL or multiple using <CTRL> and <SHIFT> keys.
-
Use the Chart Field dropdown to select data to display (will be shown on the left).
-
Hover the mouse cursor over bars to see detailed information.
-
Press Copy to Clipboard button to save the current chart view.
-
The left "Scheduled" component is always 100%.
-
The right "Production" component is the ratio of (Cut / Scheduled).
-
The subtotals of each "Scheduled" and "Production" component are shown in the waterfall from left to right.
Reports
Click in the Report panel to see the conformance scores.
-
The Scheduled Component shows the subtotals of all scheduled volumes (cut and not cut).
-
The Production Component shows the subtotals of all mined volumes (planned and unplanned).
-
Plan Compliance is the ratio of (Cut In Plan / Scheduled).
-
Plan Performance is the ratio of (Cut Total / Scheduled).
For example, the mine may move 150% of plan volume, but with only 75% conformance to the scheduled locations.
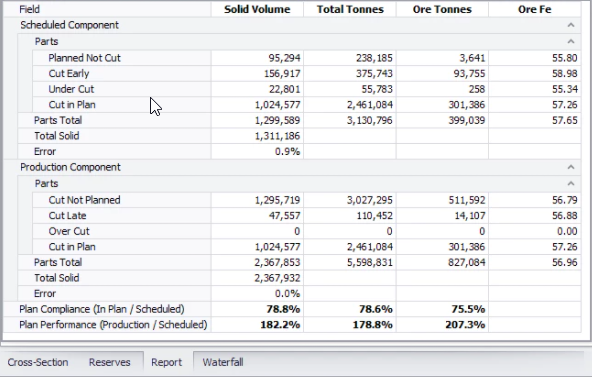
Conformance report example
Conformance reports may be customized by clicking the Configure Report button in the top right of the panel.
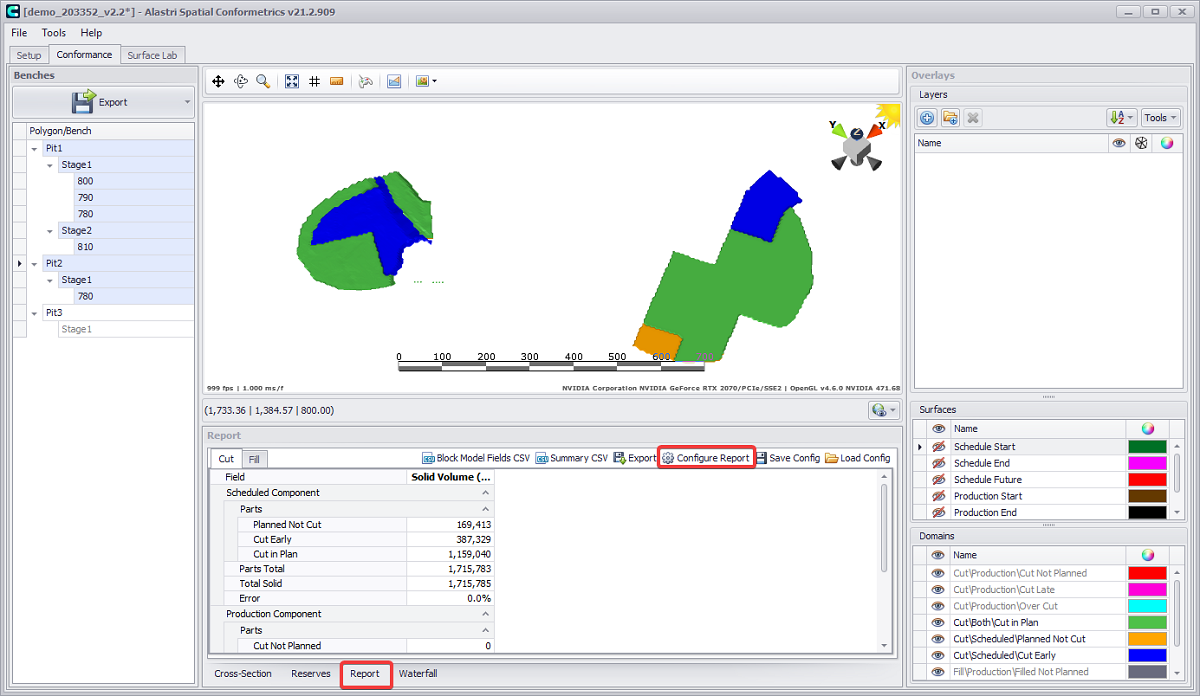
Configure Report button in the Report tab
In the Report and Waterfall tabs, Spatial Conformetrics reports Volume by default.
To report tonnes or any particular entity required custom reporting entities can be created.
Creating Custom Reporting Entity
-
Open the Report tab and press the Configure Report button.
-
Press blue plus icon. New row will be created in the Report Setup window.
-
In the Name column set a new name.
-
In the Field column select field to include in a report (“Volume”, “DryTonnes”, “WetTonnes”, “WetTonnes.Moisture” or “Ounces”).
-
In the Parcels column select required parcels to include in a report.
-
Click OK to confirm changes.
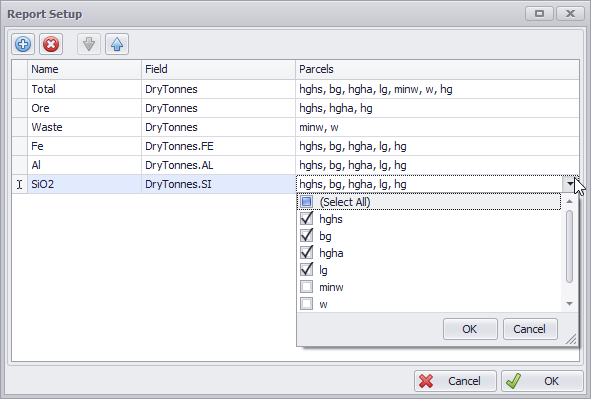
Custom Report Configuration
Created items will be displayed in the Report as columns.
Export
In the top left of the application, click the Export button and select “Export Word Document” option.
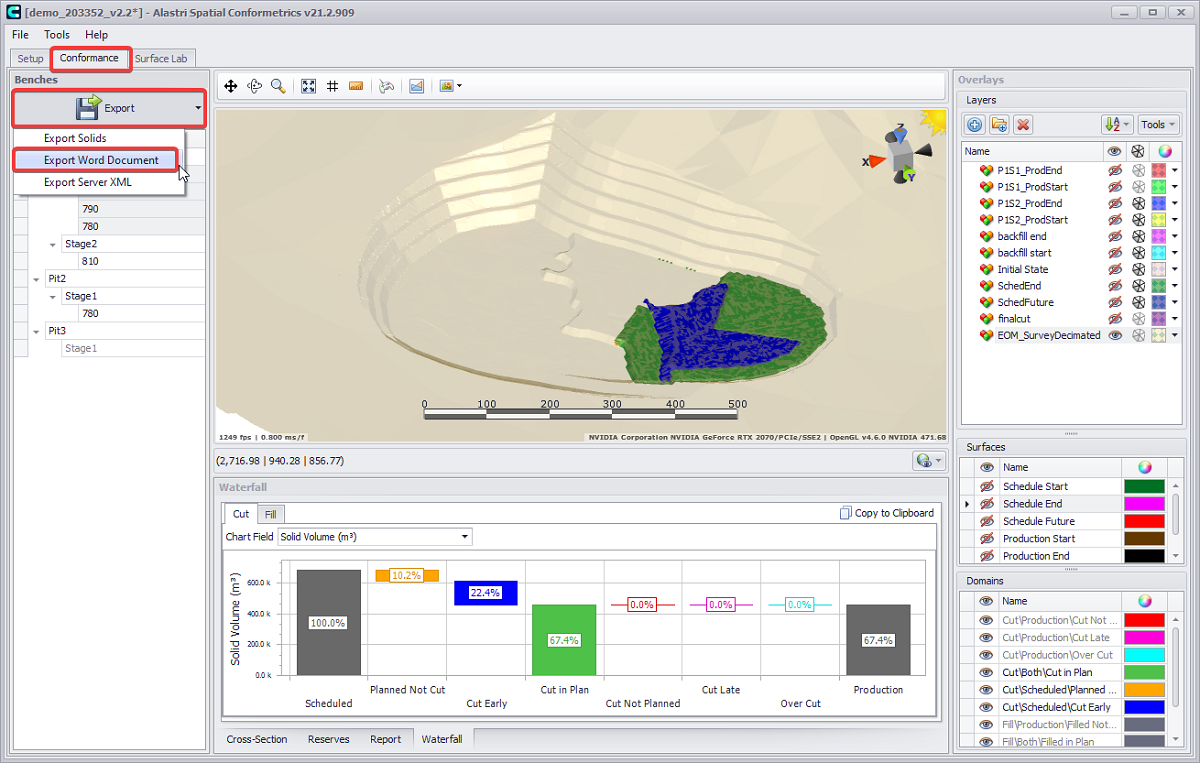
Export options dropdown
In the Generate Report dialog that opens, tick the benches to add to the report.
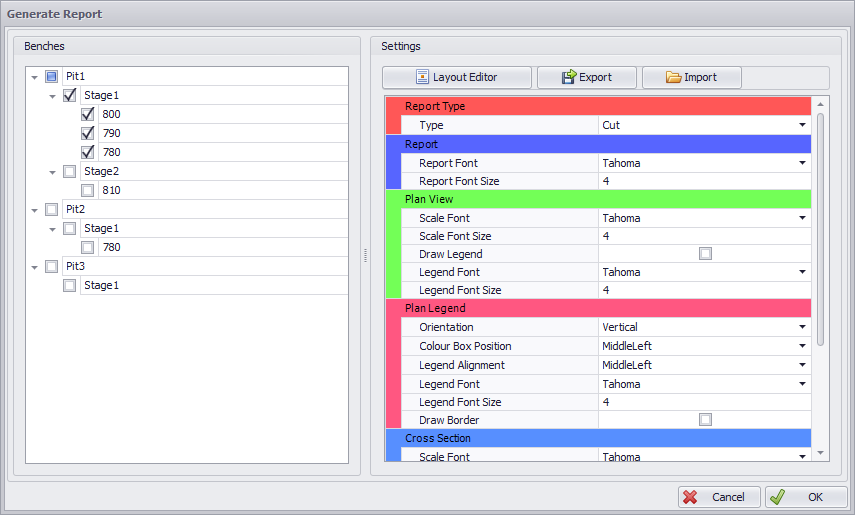
Click the Layout Editor button to open a reporting template.
-
Add more reporting elements, if required:
-
Click Conformance Elements button and select “Cross-Section” option.
-
Drag and resize the elements to configure the report as desired.
-
Type in your report <Title>.
-
Optionally, make any other settings, such as font, its color and size, indents, margins, orientation etc, similar to any standard text editor.
-
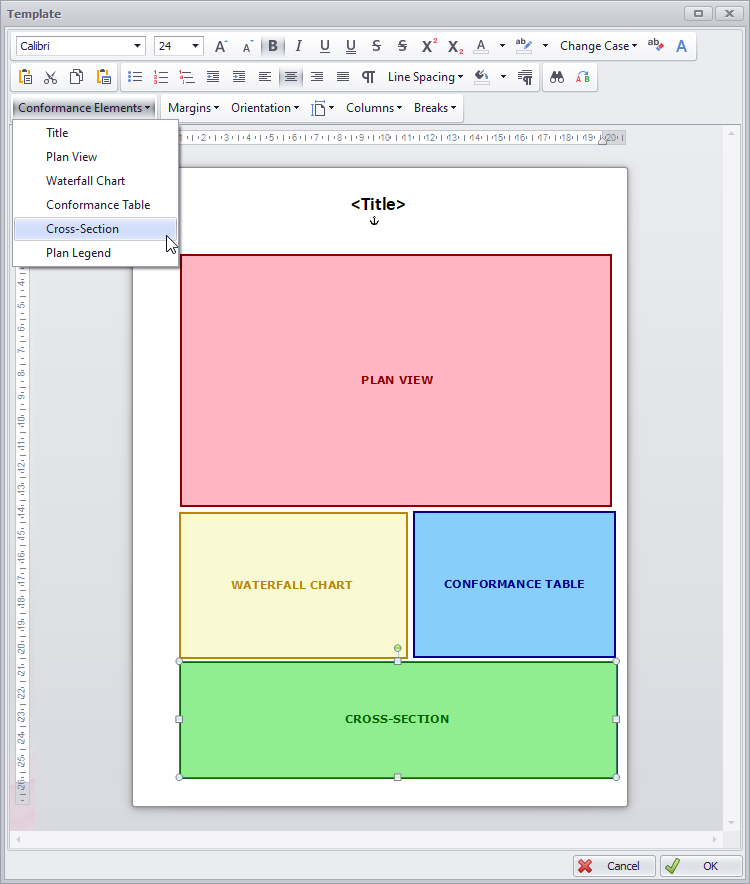
Configure your report layout
-
Click OK to accept.
-
Populate other report settings in the Generate Report dialog.
-
Select report type: cut or fill.
-
Select report, plan view, plan legend, cross-section fonts and font sizes, orientation and alignment, as desired.
-
Tick Draw Legend and Draw Border checkboxes, if required.
-
-
Click OK to confirm and generate the report.
-
Wait until the report generation is finished. Generation time varies depending on reporting fields amount.

Wait until the report generation is finished
-
Review the generated report. Scroll through all the pages to see the entire progression.
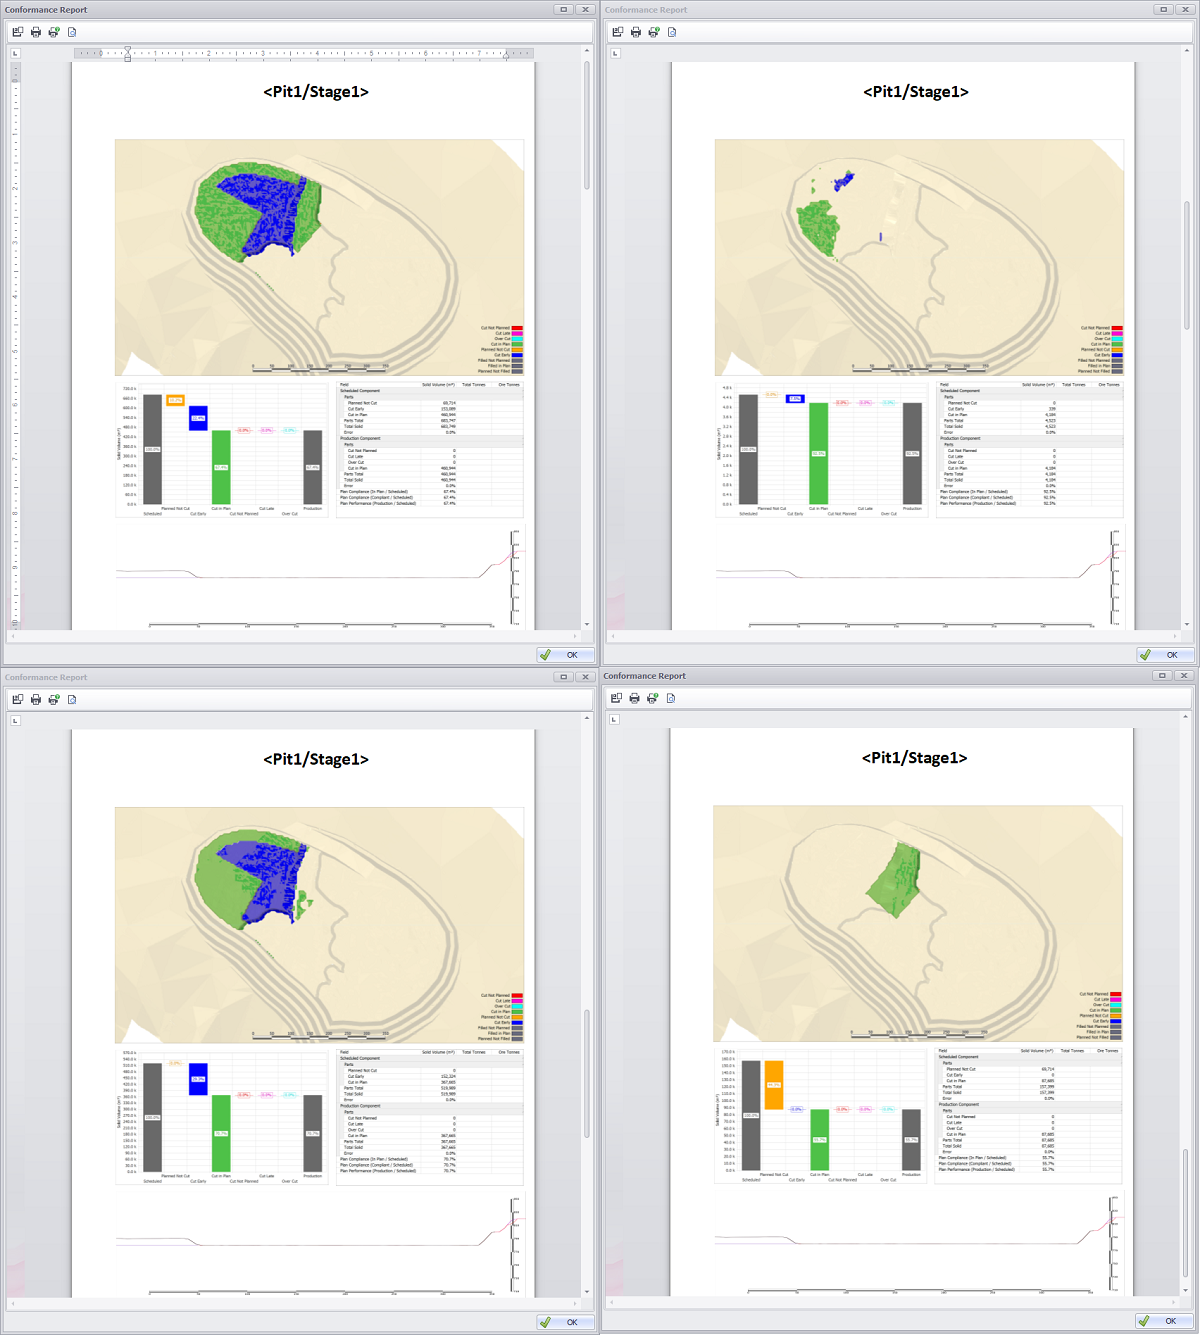
Review the generated report
-
Use top toolbar buttons to save as Microsoft Word document, print or open Print Preview window.

Select export or printing option