Working with the Custom Tab
This example demonstrates the use of the Custom tab of Data Browser. The report type you will use is one that quantifies the movement of material during a shift from a source to a destination i.e. Material Movements.
Do the following:
- Click the Movements and Measures | Material Movements report type. The definition pane opens.
- Enter the following:
Object Attribute Selected Value Site SiteA Period Shift Production Day Shift Thursday September 16, 2010 Source All Destination All Material All Measure Measure Tonne - Select the following Summary Levels:
Summary Level Value Period Shift Source Location Destination Dump - Click Run Job. The report will be displayed in Report View.
- Select Data Browser as the output from the list of format types.
- Click the Custom tab on the Data Browser display.
- Select Material Flow from the drop-down combo box on the left.
- Click Display to present the graphical summary of material as it moves between source and dump.
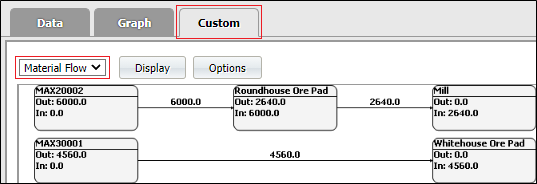
The source is displayed on the left, and the dump on the right. Material from MAX20001 has been hauled to both the Roundhouse Ore Pad and the Mill.
Displays of reports presented in both Graph and Custom cannot be exported, but can be sent to a printer.