Access Data Browser and Data Columns
Data
The Data tab (the default tab) provides a view of the report data in a tabular format. The columns shown in the data sheet are those columns that were included in the query used to generate the report. Plus and Minus squares are shown alongside those columns for which summary levels have been defined.
To display all records, click Show All.

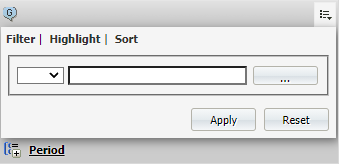
Click on the Column Options icon as shown in the red box below. Here you can: highlight columns, filter values displayed in a column, or sort the column in either ascending or descending order.
|
|
|
The data displayed in the data browser is returned by the query used to generate a report. While you can use the browser to limit what data is displayed, and determine how that data is displayed, you cannot add to the original result dataset.
To access Data Browser:
- Generate a report. By default it will open in Report View.
- In Report View, click the drop-down list in the upper-left.
- Select Data Browser.
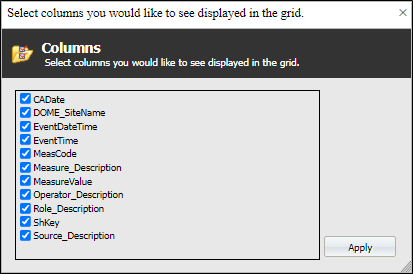
By default, all the columns of data extracted from the database are displayed.
To Show/Hide Columns:
- Click the Columns button
 to bring up the dialog to enable or disable the display of columns.
- Tick the check boxes for the columns that you want to display. Deselect the check boxes to hide the column data.
-
Click Apply.