Statistics
This
Expanded Chart Appearance Settings
Custom font, colour and size options can now be assigned to charts. For example, the Multi-purpose Chart:
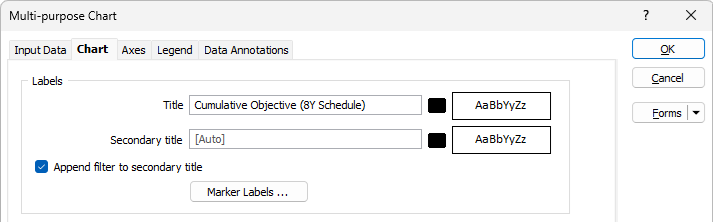
A preview of the label is displayed at the right.
You can double click the label preview to open the Text Properties form and make changes to the display settings for the label.
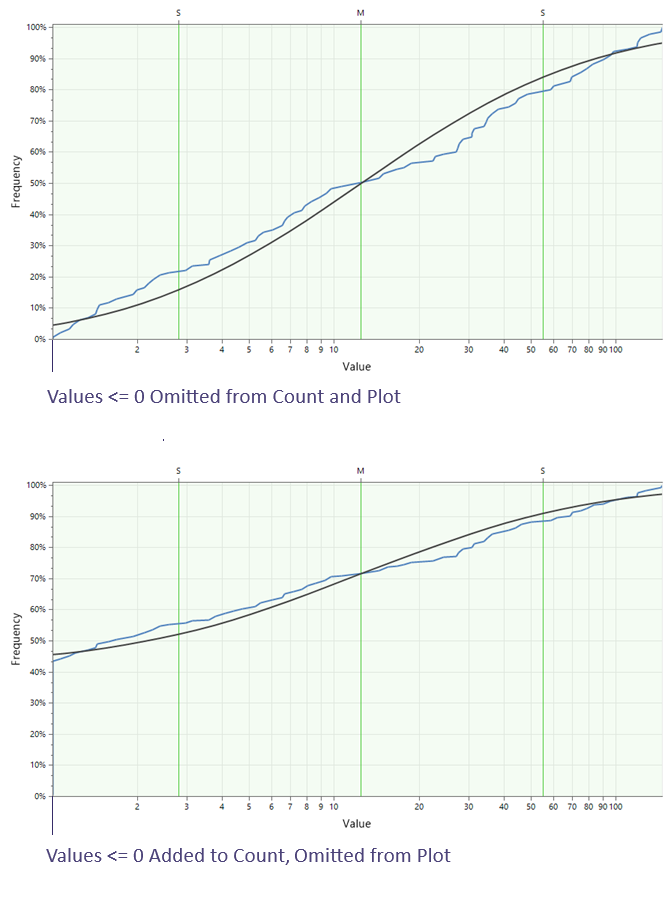
Less than or Equal to Zero Cumulative Count
Cumulative Frequency and Probability Plot charts now count the log normal discarded values (<= 0). These values are counted but not plotted. The count is used to calculate the cumulative frequency/probability of the first value >0 and the line is plotted from there.
The following illustrates the results for the new process of adding values less than or equal to 0 to the cumulative count and discarding them with a database containing multiple <= 0 values.
Save Control Files
Buttons for saving variogram control files have been added to the Semi Variogram Parameters form.
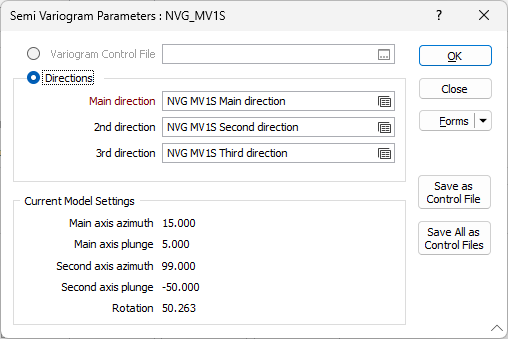
The Save As Control File button is used to save the variogram control file to path, then change the form to use this file.
The Save All as Control Files button is used to save all variogram control files, based on all the form sets saved in the current project, to a specified folder location.