Cumulative Sum Chart
Select the Stats | Quality Control | Cumulative Sum Chart menu option to setup a Cumulative Sum (CUSUM) Control Chart.
Changes in the mean are detected by keeping a cumulative total of deviations from a reference value. The CUSUM chart quickly shows small deviations from the reference. However it usually takes two or three observations to see a change on a CUSUM chart. CUSUM charts are good for detecting gradual changes in a process over time.
The CUSUM chart plots cumulative sum of the difference between the sample mean and the Reference mean against the group number. The average slope of this line will be zero when the process it measures is in control, and there is no random variation.
As soon as the sample mean differs from the Reference mean, the graph will have a slope equal to the difference between two. The points on the CUSUM graph where there is a change of slope indicate changes in the sample mean.
As soon as the sample mean consistently differs above or below the reference mean, the cumulative sum begins to increase or decrease.
File
On the Input Data tab of the CUSUM Control Chart form, double-click (or click on the Select icon) to select the name of the file that contains the standard sample data.
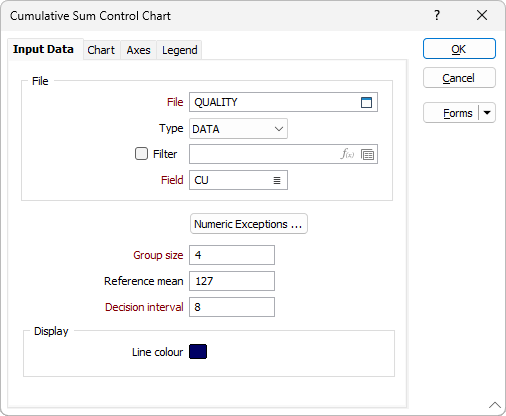
Field
If your sample group size is fixed, enter (or double-click to select) the name of the field where you entered the sample value. If the number of standard samples varies from time to time, enter the name of the field where the group mean is stored.
Numeric Exceptions
(Optionally) Use the Numeric Exceptions group to control the way that non-numeric values are handled. Non-numeric values include characters, blanks, and values preceded by a less than sign (<).
Group size
Enter the number of check samples sent to a laboratory with each sample batch. This must be constant from submission to submission. If the check sample submission size cannot be predicted, it should be set to 1.
The function uses this to calculate a mean for each sample group. It is the mean value that is plotted.
Reference mean
Enter the Field value of the standard sample. At least 25 groups of observations should be obtained, and the mean of each group calculated. The means are then averaged, the average of the means is taken as an estimate of the mean, and is used as the reference.
The reference mean is the result you expect the mean of the samples to be. You can determine this using historical data, standards or calculate it using the values in the sample data file.
If you use historical assay data, the means from at least 25 groups of observations should be used. These means should then be averaged. The result can be considered a suitable reference mean.
If you don't make an entry for Reference mean, the program will calculate and use the mean of all the groups. This can only be considered valid if you know that all groups used in the calculation are in control. Any groups that are out of control should be removed before this method is attempted.
Decision interval
Enter a value for the Decision interval. This value is added to and subtracted from the reference mean to define a range. When values fall outside of this range, the process is considered to be out of control.
Forms
Click the Forms button to select and open a saved form set, or if a form set has been loaded, save the current form set.
OK
Finally, click OK to run the function.