Lines
If you chosen to load line features, you can set their display characteristics on the Lines tab of the GIS form.
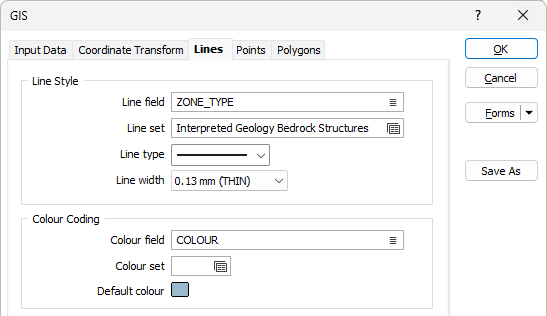
To colour code the lines, choose the name of the field that will control the colour coding and the number of the colour set. If you do not colour code the lines, they will be displayed in the default colour.
Line Style
Line sets give you the ability to apply different line styles and line widths to the polylines in a single dataset. You can apply them in the same way that you can apply colours, hatches and symbols to your data.
Line field
Double-click (F3) to select the name of a field that will be matched to the code values in a Line set.
Line set
If you have specified a Line field, double click (F3) to select the set that will be used to control the style and the width of the polylines in the dataset.
Line type
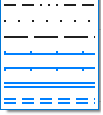
Select a line type. A preview of each line type is shown in the drop-down list. A variety of solid, dotted, and dashed line styles are available for selection.
Note: Extended line styles such as double lines are not compatible with 2D plots (they will render as a solid line) and will only display properly in Vizex and 3D Vizex plots (and screenshots). Extended line styles are displayed in blue in the Line Type drop down.
Line width
Select a (THIN, MEDIUM, THICK, or custom) line width from the drop-down list. An extensive selection of custom widths (in millimetres) are available for selection.
If the ""Use native colour and style information if available" option is selected in the Input tab, the line settings in the Input file will override the line and colour settings you make here.
Colour Coding
When strings or points are added to a new layer, a Colour field is added to the Data Properties and is auto-populated with a default colour (initially NULL) that can be quickly changed alongside other properties in the Vizex Property Pane.
Colour field
Specify the name of a field which contains the values that will be used to colour-code the display. If you are mapping Colour field values to a Colour Set, the values in the Colour field must be valid RGB, HTML Hex, Hex, or Integer colour definitions.
| Format | Example | |
|---|---|---|
| RGB | 89,169,215 | RGB ordered |
| HTML Hex | #59A9D7 | BGR ordered |
| Hex | 0x59a9d7 | BGR ordered |
| Int | 5876183 | BGR ordered: RED + (GREEN*256) + (BLUE*65536) |
You can choose to select colour values directly from the Colour field without selecting a Colour set. In this case, you can also select a formatted Colour field.
You can view and edit the RGB values assigned to the Colour field in the Property Window. Click on the ellipsis to open the Colour picker:
Colour set
To map values in the Colour field to the colour values in a Colour set, double click (F3) to select the set that will be used to control the display colour. Right-click (F4) to create or edit a Colour set.
Default colour
Double-click (F3) to select the colour that will be used when a Colour field or a Colour set is not defined - or when a value in the Colour field is either not valid or is not mapped in the Colour set.
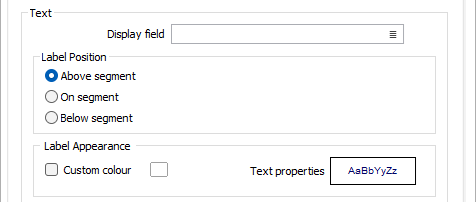
Text
Display field
Specify the name of a Display field containing line label values. If you leave Display field empty, only the lines will be displayed.
Label Position
Select where you want the label to be positioned, either Above, On, or Below the string segment.
Label Appearance
Select the Custom Colour check box and then double click on the icon (F3) to select the colour which will be used for the labels.
Double-click on the Text Properties Preview box to select a font and set text properties for the labels.
Label Frequency
Select an option determine the frequency with which the segments will be labelled.
Show all
Select this option to label all of the points on each string.
Show these points
Select this option to specify a list of sting point numbers to label. The approach is similar to that used to specify the pages to be printed when printing a document in Microsoft Word. You can enter point numbers separated by commas, or use a hyphen to specify a range of point numbers (as shown in the following example).
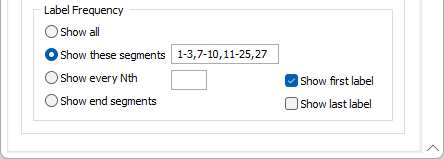
Show every Nth
Select this option to label every Nth point, where N is an integer value you enter.
Show end segments
Select this option to label the end points of each segment.
Unless you have selected Show all, you also have the option of labelling the first and last points of each string:
Show first label
When selected, this check box will label the first point of each string.
Show last label
Indicates, when selected, that the last point of each string is to be labelled.
The Label every Nth value is defined in units of “contours”. A value of 5 will label every fifth contour starting from the lowest.
So if, for example, a data set is being contoured with a minimum contour of 0, a maximum of 100, and a contour interval of 5, setting Label every Nth to 5 would mean that contours are labelled at 0, 25, 50, 75 and 100. A Label every Nth value of 4 will put the contours at 0, 20, 40, 60, 80 and 100.
If no Contour minimum is set, a default Contour minimum is applied which ensures that labels are positioned on contours which are multiples of the Contour interval * the Label (every nth) spacing.