Types of semi variogram model
This topic describes the most frequently used types of basic variogram model, where user inputs are:
| = | slope | = | range | = | decay | |||
| = | power | = | partial sill | = | cycle distance |
represents the current lag interval and represents the calculated semi-variance at that interval.
Linear
General Linear
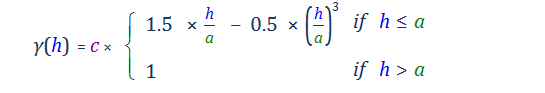
Spherical
Exponential
Gaussian
Hole Effect
Hole Effect reflects a sample distribution along grid drilling lines. Cycle distance is the distance between peaks and troughs in the cycle. Decay is the damping factor, the smaller the factor the faster the damping.
Paddington Mix
Although the Hole Effect model is a little unstable mathematically, it can be combined with a Spherical component to produce a more reliable result. This combination of Spherical and Hole Effect components is known as the Paddington Mix.
For an explanation of estimation using geostatistics and other related subjects, refer to:
- Chiles, , J.P., P. Delfiner, 1999, Geostatististics, Modelling Spatial Uncertainty, Wiley-Interscience
- David, M., 1982, Geostatistical Ore Reserve Estimation , Elsevier Scientific Publishing Company, Amsterdam
- Goovaerts, Pierre. 1997, Geostatistics for Natural Resources Evaluation , Oxford University Press, New York
- Isaaks, E. H. & Srivsatava, R. H. 1989, An Introduction to Applied Statistics , Oxford University Press, New York
- Wackernagel, H., 2003, Multivariate Geostatistics, Springer