Display
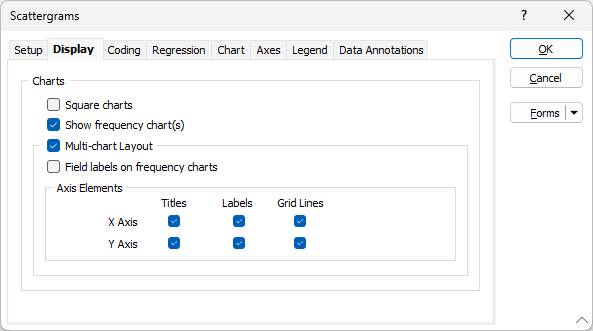
On the Display tab of the Scattergrams form, set display options for the chart.
Square charts
If X and Y axis values have the same magnitude, select this option to automatically adjust the axes to produce a square chart.
Show frequency chart(s)
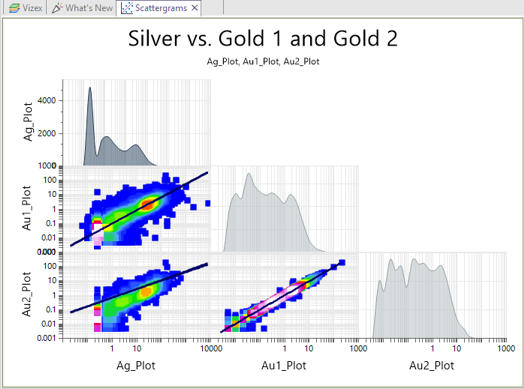
Select this check box to show frequency charts alongside the scattergram charts. In Scatter Matrix mode, the frequency graphs are shown along the diagonal of the chart:
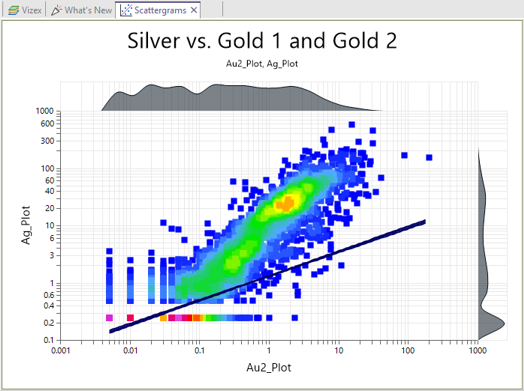
In Single scattergram mode, the frequency graphs are shown along and aligned to the axes:
You can also toggle a button on the Chart ribbon to Show (or Hide) the frequency charts:
![]()
Multi-chart layout
Select this option to add a graph to the chart for each combination of the listed fields.
Field labels on frequency charts
If you have selected Show frequency chart(s), select this check box to show field labels on those charts.
Axis Elements
In a Multi-chart Layout, choose whether to show Titles, Labels and Grid Lines on each chart.