Percentile Value
A common statistical problem in mineral resource modelling is to find an allowable upper threshold for the input data. Values that fall above this threshold are assumed to be outliers and their values are trimmed or ‘cut’ to the threshold value. This threshold is called the upper or balancing cut.
One way to determine the upper cut value is to use the cumulative frequency curve to locate the grade corresponding to a given percentile. A typical upper cut value is the 97.7th percentile, which is sometimes rounded to 97.5 in practical use. In a normally distributed dataset the 97.7 percentile corresponds to the value two standard deviations to the right of the mean, which is easily confirmed by summing the individual areas to the left of +2 standard deviations (+2 SD), as shown by the shaded area in the following diagram:
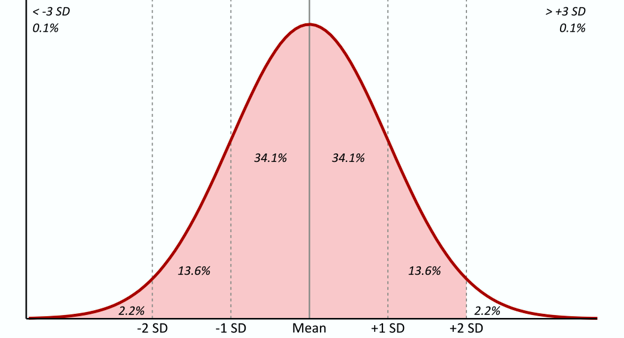
In raw data the 97.7th percentile is simply the value below which 97.7% of the data occurs.
|
|
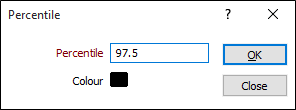
Click the Percentile button on the Chart toolbar to display a value at a specified percentile. Specify a colour for the line that will be drawn on the graph. |
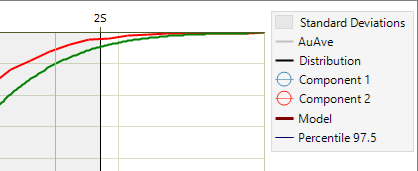
When you click the Show Legend button to display a legend, any percentiles you have defined are included:
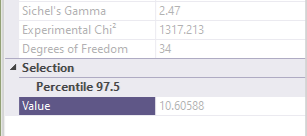
Simply click on a Percentile line to display the value corresponding to that percentile: