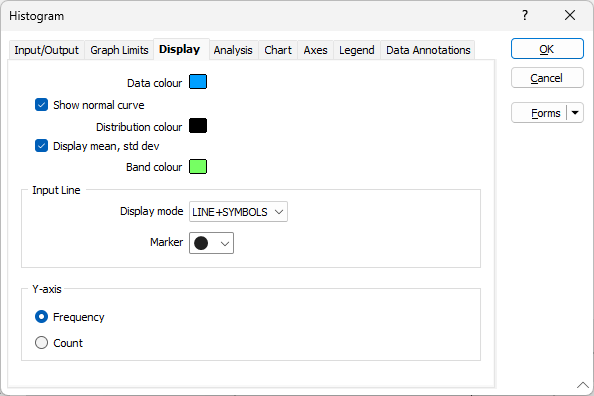
Display
On the Display tab of the Histogram form you can set colour and symbol options, choose whether to show the normal curve, display the mean and standard deviation, and show either the frequency or a count of the items in each bin.
Data colour
Select the colour for the bars on the chart.
Show normal curve
Select this check box if you require a curve representing a normally distributed data set with the same mean and standard deviation as the displayed data. This provides a visual guide as to how well the data fits a normal distribution.
In natural log mode, the normal curve is a log-normal population having the same geometric mean and natural log standard deviation as the displayed data.
Distribution colour
Select the colour for the normal curve line. This should be different to the colour used for your data.
Display mean, std dev
Select this check box to display the mean of the data set and display one and two standard deviations as vertical lines on the chart. These lines will coloured using the specified Band colour.
Band colour
Select the colour that will be applied to the vertical lines and the band between the mean and the two standard deviations.
It should be noted that one standard deviation from the mean encompasses approximately 68%, two standard deviations enclose approximately 95% and three standard deviations approximately 99% of the data (for a normal distribution).
Input Line
Display Mode
Choose whether to display LINES, LINES + SYMBOLS, or SYMBOLS on the histogram.
Marker
If you have chosen to display symbols, select a marker symbol for the points on the chart. A range of standard (Circle, Square, Diamond, Pentagon, Hexagon, Star, Triangle, Plus, Cross) marker symbols are available for selection in a drop-down list.
Y Axis
Along the Y axis, choose whether to display the frequency of the items in each bin, or a count of the items in each bin.
The Y Axis will be labelled "Frequency" or "Count" accordingly. If a title is specified on the Axes tab, "Frequency" or "Count" will be added as a prefix.

With Multi-chart layout selected, you can select the relevant radio button to specify a Gridded, Horizontal or Vertical layout for the display.
