Display
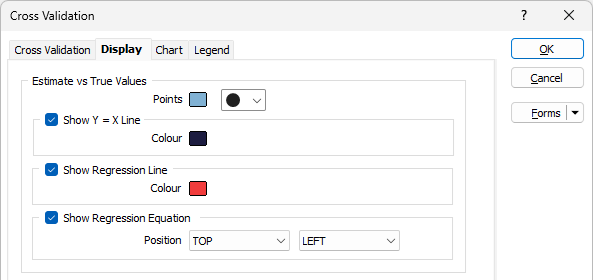
On the Display tab of the Cross Validation form, set display options for the components of the chart.
Estimate vs True Values
Double click (F3) to select a colour for the displayed points.
Select a shape for the displayed points. A range of standard (Circle, Square, Diamond, Pentagon, Hexagon, Star, Triangle, Plus, Cross) marker symbols are available for selection in a drop-down list.
Show Y = X line
Select this check box to display a line indicating where the two distributions are exactly equal. The nearer your data is to this line, the better the match between the two distributions.
Double-click to select the colour that will be used to depict the line.
Show Y = X Line
Select this check box to display a line indicating where the two distributions are exactly equal. The nearer your data is to this line, the better the match between the two distributions.
Double-click to select the colour that will be used to depict the line.
Show Regression Line
Select this check box to display a regression line. Double-click to select the colour that will be used to depict the line.
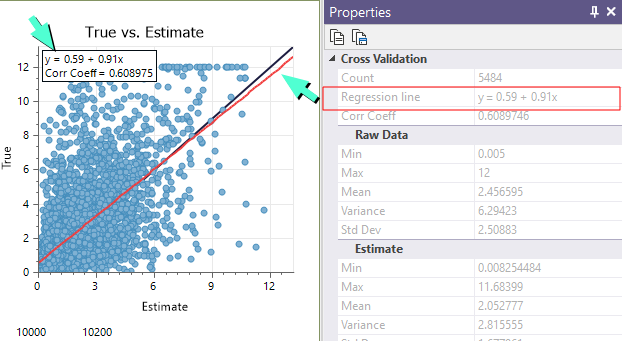
Show Regression Equation
Select this check box to show a regression equation. Accept the default or choose a Vertical (TOP, CENTRE, BOTTOM) and Horizontal (LEFT, CENTRE, RIGHT) position for the equation box, for example Top/Left:
Sample Locations
Select an Orthogonal (PLAN, LOOKING NORTH, LOOKING WEST) orientation. You can also change the orientation on the Chart tab when the chart is open.
Double click (F3) to select a colour for the displayed points.
Select a shape for the displayed points. A range of standard (Circle, Square, Diamond, Pentagon, Hexagon, Star, Triangle, Plus, Cross) marker symbols are available for selection in a drop-down list.
Standard Error Histogram
Choose a colour for the bars on the plot and specify the number of bins in the Bin count box. Increasing the count adds detail to the result.
Estimate vs Standard Error
Double click (F3) to select a colour for the displayed points.
Select a shape for the displayed points. A range of standard (Circle, Square, Diamond, Pentagon, Hexagon, Star, Triangle, Plus, Cross) marker symbols are available for selection in a drop-down list.
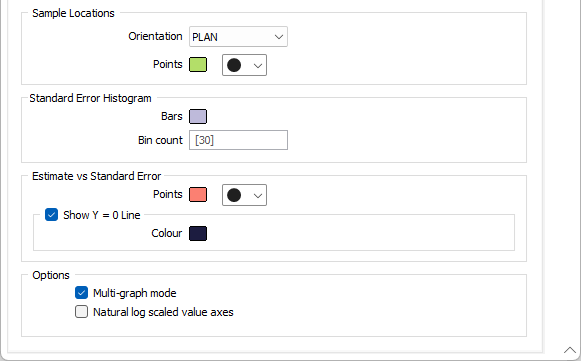
Options
Multi-graph mode
Select this option to display the chart in Multi-graph rather than Single graph mode. You can also toggle between modes on the Chart tab when the chart is open.
![]()
Natural log scaled value axes
Select this option to calculate the values along the X axis and Y axis in a natural logarithmic range.