Gridding Method
On the Gridding Method tab, choose a gridding method. Which method you choose will depend on your requirements and the type of data being processed.
You can also select an option to smooth the grid surface - see Smooth Grid.
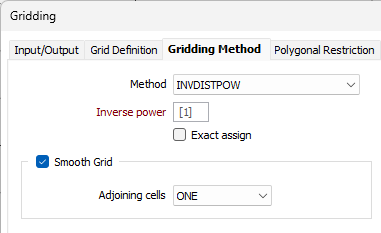
Method
Except for NEAREST NEIGHBOUR and those methods that apply Minimum Curvature (MINIMUM CURVATURE and INVDISTPOW + MINIMUM CURVATURE), all the methods involve the use of a search function that finds the data points around each grid node, and processes that information to give a best guess of the value to use at the node.
The search function in effect moves an ellipse (which is usually a circle) from node to node and calculates the value at each by applying mathematical processing to the data points falling within the ellipse. You can graphically display the search as it is carried out.
INVDISTPOW (Inverse Distance Power)
The weighting given to each point that falls in the search ellipse is inversely proportional to its distance from the centre raised to the value entered in Inverse power.
ANISOTROPIC IDP
With this method the weighting given to each point is inversely proportional to its distance from the centre of the search ellipse divided by the distance to the perimeter of the search ellipse (in the same axis). That is, a point located on the perimeter of the search ellipse on the minor axis and one on the perimeter of the search ellipse in the major axis will be given the same weighting when the block estimate is calculated. A point half way along any axis will receive twice the distance weighting of a point on the perimeter along the same axis, (triangulation is used to calculate these distances for points that do not fall on the axes).
KRIGING
If you choose KRIGING as the Gridding Method, you need to have already used the Semi Variogram function (and possibly the Trend Surfaces function) under the Stats menu to develop a suitable semi variogram model. You will need to make a note of, and then enter, the model parameters.
For the following 2 methods, a search ellipse is not used (and the Data Search button is disabled):
MINIMUM CURVATURE
This method attempts to fit curves with the least acute bends between points and produces smooth contours.
The Minimum Curvature method is suitable for datasets with sparse and uneven data points. Poor results may be obtained from datasets which have densely distributed data points (such as those derived from contour files).
For more information refer to: "Gridding with continuous curvature splines in tension". H.F. Smith and P. Wessel (March 1990) GEOPHYSICS VOL 55, NO 3: Pages 293-305.
INVDISTPOW + MINIMUM CURVATURE
With this method a fixed sized grid is created using IDW with a huge search radius that includes all input points. After that the rough IDW grid is used as an input into a minimum curvature spline.
The minimum curvature spline used here is different to the one used by the "proper" minimum curvature method, as described by Briggs and widely implemented.
NEAREST NEIGHBOUR
Selects the nearest point to the node and uses its value. If there is more than one point at this distance, the values are optionally averaged or the minimum or maximum used.
THIN PLATE SPLINES
With this method the points of the grid are interpolated using domain decomposition and a Thin Plate Spline (TPS) kernel.
For this method, the number of input points cannot be greater than 3000 points. There is a workaround, however: You can add a RANDOM field to the Input file and populate that field with random numbers between 1 and 3000. To use a third of the points in the file, apply a filter where the values in the RANDOM field are less than 1000.
ABOS Interpolation Algorithm
ABOS (Approximation / interpolation Based On Smoothing).
Inverse Power
For the INVDISTPOW and ANISOTROPIC IDP methods, the value you specify here will determine the extent to which points distant from nodes affect the calculated value. Your choice will depend on the type and distribution of the data.
Exact assign
When this option is selected, the interpolator visits every grid cell and a set of nearest points matching the search criteria is gathered for each grid cell. The interpolator then determines if any of the nearest points (matching the defined search criteria) also fall within the grid cell boundaries. If one or more points do fall within the cell boundaries, then the interpolator will calculate an arithmetic mean value using only those “in cell” points. That value is then assigned to the corresponding grid node, rather than a value calculated using the selected interpolation method.
This option is disabled when the chosen gridding method is MINIMUM CURVATURE, INVDISTPOW + MINIMUM CURVATURE, NEAREST NEIGHBOUR, THIN PLATE SPLINES or ABOS.
Smooth Grid
(Optional) Check the Smooth Grid Surface check box and select either ONE or TWO adjoining cells. In the former case, the current cell’s value is made the mean of the estimates in the adjoining eight cells, while in the latter case it is made the mean of those of the adjoining 24 cells, as illustrated in the following diagram.
Smoothing works best with large areas that have small cells. The results may be unexpected if you use it with large cells in small areas.
Tension
The MINIMUM CURVATURE method attempts to fit curves with the least acute bends between points and produces smooth contours. You can control how closely the curve fits the original data via a 'tension' parameter. The higher the tension value, the closer the shape of the smoothed string will be to the original data.

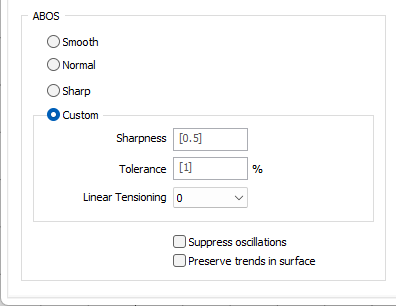
ABOS Interpolation Parameters
ABOS (Approximation / interpolation Based On Smoothing) produces similar results to kriging (no nugget, no negative weights) but is much faster.
Kriging Model Parameters
If you choose KRIGING as the Gridding Method, you will need to make a note of, and then enter, the following parameters:
- Omnidirectional Select this option to specify variogram model parameters for the main direction only. The type of the model you select will determine which inputs and components are enabled. Press F3 to load a saved form set. To set semi variogram model parameters, right-click and select Edit (F4) from the menu.
- Multiple directions Select this option to specify variogram model parameters for the main direction. Model parameters for the second and third directions may also be specified. Press F3 to load a saved form set. To set semi variogram model parameters, right-click and select Edit (F4) from the menu.
Drift
Choose the Drift type. NO DRIFT assumes the data is stationary and applies ordinary (or punctual) Kriging. LINEAR applies a first order equation to determine drift, and QUADRATIC applies a second order equation to determine drift.
Set negative kriging weights to zero
When KRIGING is the chosen gridding method, select this check box to adjust the negative weights so that they have no effect. If this option is not selected, some sample location configurations can generate small negative cell values, even though all of the samples have values greater than, or equal to, zero.

Search
Use the Search group to define the shape, size and other characteristics of a search ellipse. Search options are not applicable to the MINIMUM CURVATURE, INDISTPOW + MINIMUM CURVATURE, NEAREST NEIGHBOUR and ABOS methods.
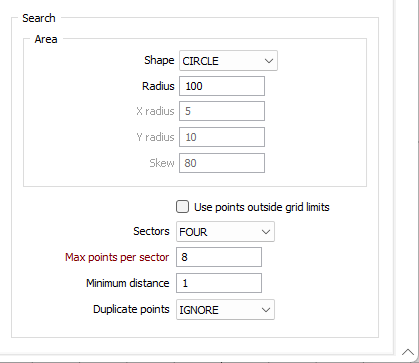
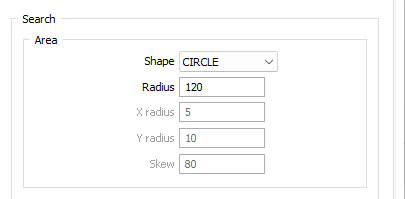
Search shape
You can select either a CIRCLE or an ELLIPSE as the search area shape. A circle is more usual unless the data is concentrated in some way that suits an ellipse better.
Search radius
When the search shape is CIRCLE, accept [AUTO] as the default or enter the radius of the data search circle in X axis units.
When the search radius is unspecified [AUTO], it is automatically calculated as 10% of the grid's size in the X dimension.
X and Y Search radius
When the search shape is ELLIPSE, accept [AUTO] as the default or enter the radius of the search ellipse in the X and T directions. In general, a good starting point is to make the radius about 1.5 to 2 times the grid surface spacing.
When either the search X radius or Y radius are unspecified [AUTO], they are automatically calculated as 10% of the grid's size in the X dimension.
Search skew
A search ellipse can be skewed if an examination of the raw data suggests this may improve the fit of the grid surface to the data. Enter the rotation of the search ellipse in degrees, measured clockwise from zero at the top of the screen.
Use points outside grid limits
(Optional) Select this option if you want to include points outside the grid surface limits (but within the search ellipse).
Sectors
This number defines how many parts the search shape will be divided into for the data search.
The maximum number of points is multiplied by the number of sectors to determine how many data points can be used within the overall search shape. For example, if you choose FOUR sectors, the search shape is a circle, and the maximum number of points is 15, then the nearest 15 data points in each quadrant will be used, totalling 60 points.
This option can eliminate the clustering effects of irregularly spaced data.
Max points per sector
The maximum number of points to be used in the estimation of a block value. This input is compulsory. Enter a value which is greater than zero. The maximum allowable value is 150.
When more than one sector is defined, each sector can independently use up to the maximum number of points.
(e.g. 150 pts x 4 sectors = 600 pts)
If more than the maximum number of points is found within a sector the closest points are used.
Minimum distance
Enter a minimum distance in X data (axis) units. The estimation algorithm will use this as the distance between a data point and the centre of the block being estimated.
This deals with the situation where the value of a data point very close to the centre of the block being estimated becomes in effect the value of the block, overpowering the effect of other data points found within the search ellipse.
If the distance between a data point and the block centre is less than the value entered here, the value entered will be used instead of the true distance.
Duplicate points
Choose how the function should deal with Duplicate points: IGNORE, AVERAGE or take the MAXIMUM or MINIMUM value. Duplicate points are those with the same coordinates but different data values.
Note: Duplicates are defined by their X-Y location. If an X-Y combination exists, the first instance is used. All other instances of that X-Y combination are treated as duplicates and ignored.
See: Duplicate Points
