Display
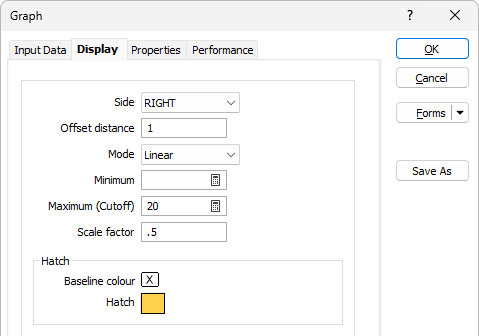
Use the options provided on the Display tab to determine the type and appearance of the graphs in the Drillhole display.
Side
The graph can be displayed on the LEFT or RIGHT of the drillhole trace. Use Side to determine its location.
Offset distance
Define the distance, in grid units, that the hatch will be offset from the trace. The default is 1. Both positive and negative values are acceptable.
Mode
Select a graph mode. You can use values directly from the nominated field in the input file, or you can take natural logs of the data before it is displayed. To use the base values as they occur, choose NORMAL from the Mode list. Choose NATURAL LOG to convert the values before they are displayed.
Minimum and Maximum (Cutoff)
You may need to recalculate the minimum and maximum graph values to produce a correct histogram from older (earlier version) form sets, but generally only for those incorporating the natural log transformation.
To change the graph minimum/maximum, click the calculator icons to the right of the Minimum and Maximum values.
![]()
You should not have to change the graph minimum or maximum of existing forms incorporating normally-distributed data.
Scale factor
Enter a scaling factor - typically a value <1.0. The value to which it is applied is multiplied by this factor before being displayed. Use this option to prevent graphs from overwriting other holes.
Hatch
Baseline colour
Select a colour. The baseline for the graph will be drawn parallel to the drillhole trace in this colour.
If you do not enter an offset for the graph, the baseline will overwrite the trace and trace information be lost.
Hatch
Select this option when you want to show hatching on or beside the drillhole trace or trench. Hatching can be used to define downhole geology, alteration or veining. Click the More button to open the Hatch dialog box. The entries you make here control how the hatching will be applied and the characteristics of the hatch itself.
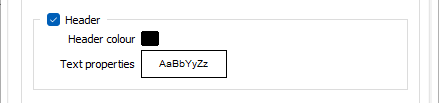
Header
If this option is selected, the name of the field from where the graph data was obtained can be displayed as a header beside the scalebar. You can select the colour and the font in which the header will be displayed.
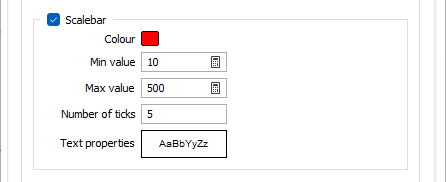
Scalebar
If you want to display a scalebar with the graph, select this option. The scalebar will extend from the bottom of the hole. If the bottom of the hole does not occur on the section, the scalebar is displayed where the hole exits the section.
Colour
Double click (F3) to select the colour to be applied to the ticks on the scalebar.
Min/Max values and number of ticks
Define the minimum and maximum values that will appear on the graph and the number of ticks that will be between them.
Text properties
Double-click to select a font and set the properties of the text used to annotate the scalebar.
Smoothing
To smooth curve data, specify a Smoothing size which is the number of points used in a moving average filter. You must specify at least 2 points. The greater the number of points, the smoother the curve.
A smoothing size of 11 will take each data point and average them with 5 data points above and 5 data points below, and then plot those points with their moving average values rather than their actual values.
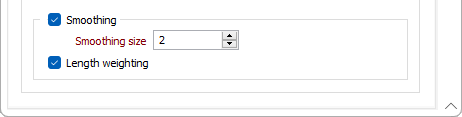
Select the Length Weighting option to apply a length weighting to the smoothed data. This may be useful for data with interval lengths that vary significantly.