Statistics
This
Multiple Grade Tonnage Curves
Support for multiple input files has been added to the Grade Tonnage Curve tool in Stats | Analysis with the introduction of a grid.
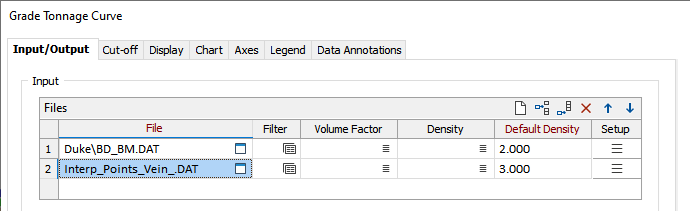
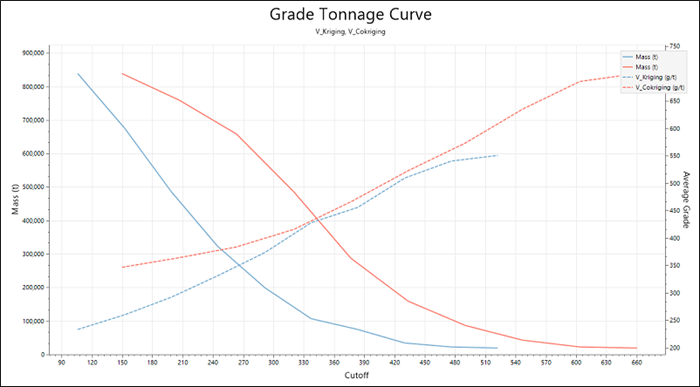
In the Files grid, you can select multiple files containing one or more Grade fields and 3D coordinates. When configuring the grade fields in the Attributes grid, the file can be selected for the row. The resultant Grade Tonnage Curve chart will display the configured values together on the chart:
Use Alpha, Beta and Gamma
Support has been added for Linear Structure Gamma values for Stereonet drillhole database input.
If you select the Use Alpha, Beta and Gamma option, those angles in the Event file will be used to define the orientation of the lineation data, rather than the Plunge and Trend values.
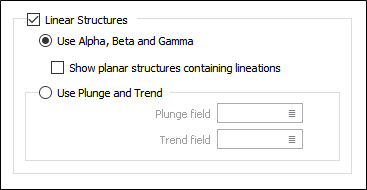
Additionally, the Show planar structures containing lineations option has been added to allow planar data containing lineations to be shown. If the option is not selected, planar data will not show.
Natural Log Scale Support
Support has been added to the Spider Graph tool for lognormal scale.
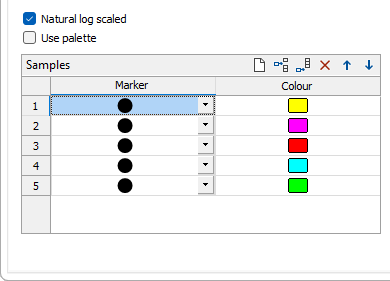
With the Natural log scaled check box selected, lognormal scale is enabled for the Spider graph. This will scale the data values and set the Y axis to natural log scaled.
Additional improvements were also added to Spider Graph with the Sample field now optional and automatically populating with different colours. A default value of [1] has been added to the divisors in the variable grid and multiple fields can now be selected for the grid.
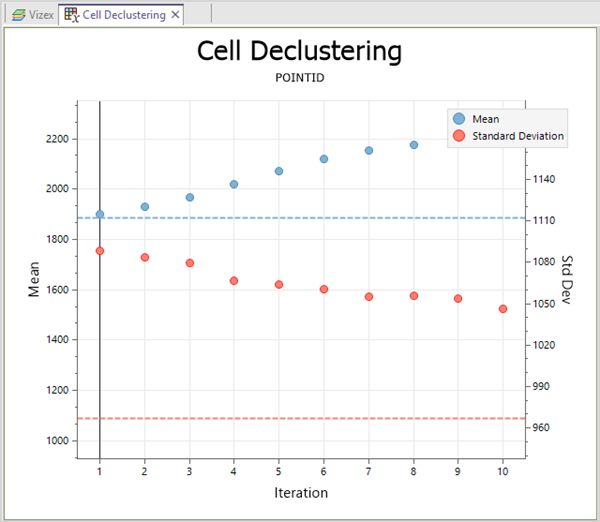
Standard Deviation Display
An option to display or hide the Standard Deviation has been added to the Cell Declustering tool. The option is enabled by default, as the Standard Deviation will be displayed in most cases.
Additionally, the Standard Deviation is now plotted on a secondary Y axis.