Statistics
This
Decimal Precision in Chart Properties
The representation of decimal values in Chart Properties has been improved to use the decimal precision of the fields in the Input file where possible and otherwise report values to 3 significant places.
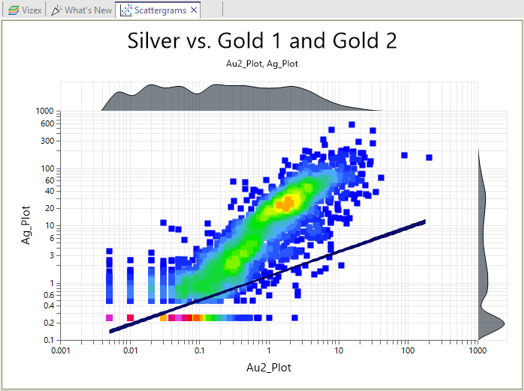
Scattergrams
On the Stats tab, in the Exploratory Data Analysis group, when you click Scattergrams to calculate correlation statistics for the variables in a file, instead of showing the multiple linear slope of regression when plotting more than two fields, a model is now shown for each combination of fields.
Scatter Matrix mode
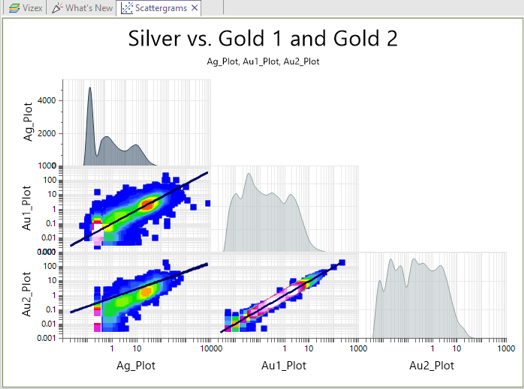
When the Multi-chart layout display option is selected on the Display tab of the form, it is now possible to toggle between showing individual charts in sequence or showing all charts on the same canvas in Scatter Matrix mode:
![]()
The layout of the matrix has also been improved. This includes the ability to double-click on a graph to expand it (and exit Scatter Matrix mode).
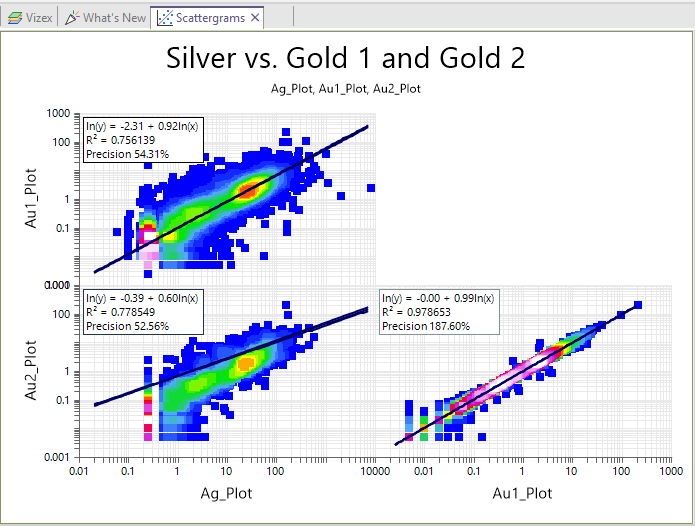
Show Line and Show Equation buttons on the Chart ribbon can also be used to toggle the display of the Regression line and the Equation, respectively:
![]()
![]()
Axis Elements
The option to display histograms of the data for each axis is now provided on the Display tab of the form.
Frequency Chart(s)
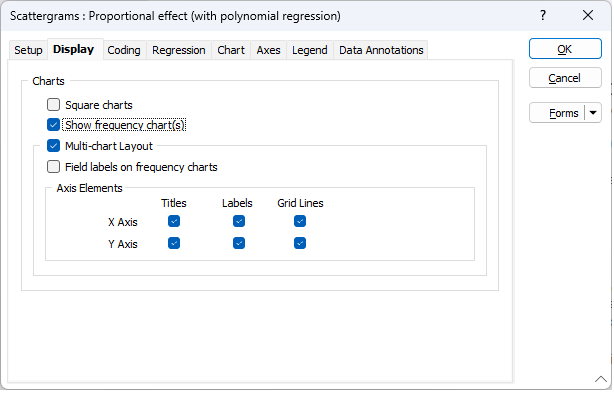
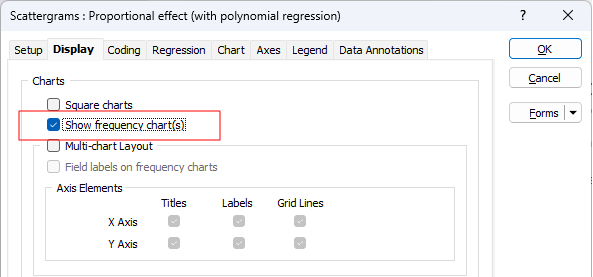
The option to display a univariate frequency chart alongside each scattergram is now provided on the Display tab of the form. An option to show field labels is also provided:
In Scatter Matrix mode, the Frequency graphs are shown along the diagonal of the chart:
In Single scattergram mode, the frequency graphs are shown along and aligned to the axes:
A toggle button on the Chart ribbon allows you to show or hide the frequency chart(s):
![]()
Grade Tonnage Curve
On the Stats tab, in the Analysis group, when you click Grade Tonnage Curve to plot a grade tonnage curve, you can now toggle a check box to show or hide the mass on the chart.
This option is only visible/applicable when either of the first two display mode options are selected (when cutoffs are displayed on the x-axis).
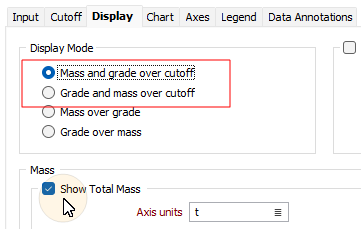
This allows you to plot the Element Mass without plotting the Total Mass.
Mass Units
Kilotonnes (kt) has been added to list of Mass units that can be selected.
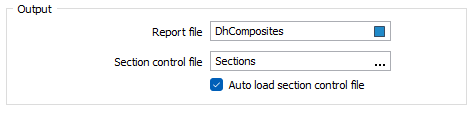
Swath Plot
On the Stats tab, in the Analysis group, when you click Swath Plot to spatially summarise any combination of data, when a plot is created in Regular swath mode, you can now select an auto load option to visualise the swaths and the axes extents written to a Section control file:
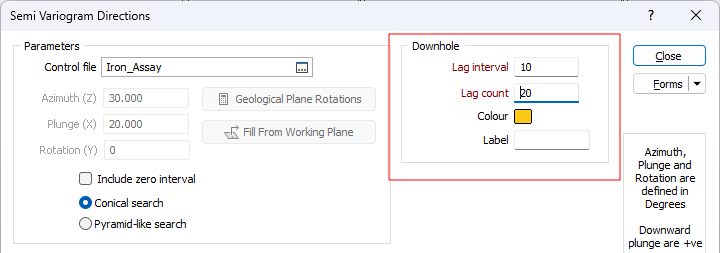
Three Axes Model: Downhole Variograms
When the Three Axes Model input method is selected in the Variograms group on the Setup tab of the Semi Variograms form, to assess the short range continuity and nugget effect, theoretical variograms are now projected in additional directions, including downhole:
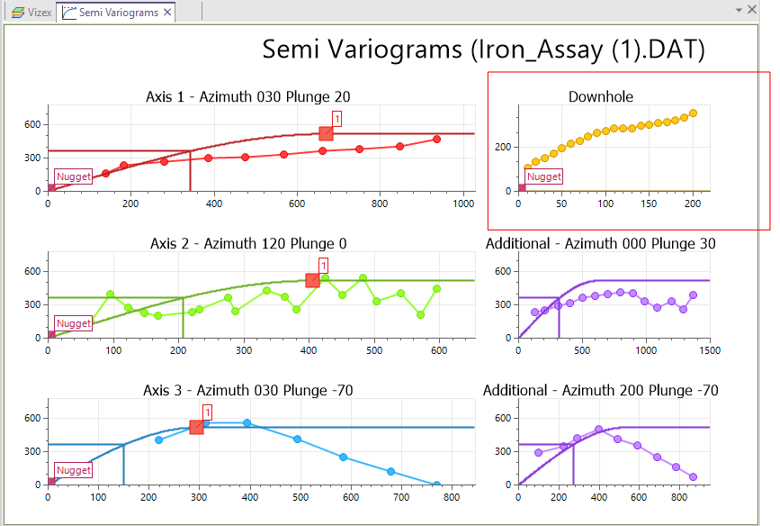
On the Chart ribbon, you can toggle the display of additional directions (including Downhole) on and off using the Show additional directions button.
![]()
Normalisation Options
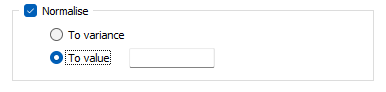
On the Setup tab of the Semi Variograms form, you can now choose to normalise to the variance or to a specific value:
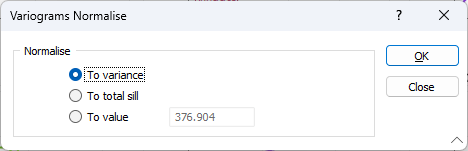
When the chart is open, you can toggle Normalisation from the ribbon in the Variograms group. Select Setup from the drop-down tool menu to select a different Normalisation mode.
Changing the Normalisation method will affect the chart and the model parameters.
![]()
The Normalisation method can also be toggled from the Variogram Control File Viewer (when you select Save Control File on the ribbon). The chosen Normalisation method is also output to the Variogram Report.
Variogram Types, Normal Scores & Backtransformation
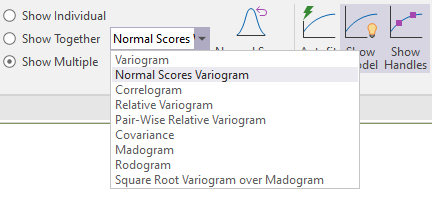
It is now possible to change the variogram type and quickly recalculate the variograms while the Variogram Map or the Variogram Chart is open. You can also select a Normal Scores Variogram type from the list of types:
When you fit the variograms in Normal Scores mode (by selecting Autofit Model from ribbon), you can then click a dedicated Normal Scores Backtransformation tool to backtransform to the original data:
![]()
Variogram Control File
On the Chart | Semi Variograms tab, in the Variograms group, when you click Show Additional Directions to toggle the display of additional directions, those directions are now written as parameters to the Variogram Control File, from where they can be re-loaded.
![]()
Where applicable, Normalisation and Normal Scores parameters are also written to the file.
Cross Validation
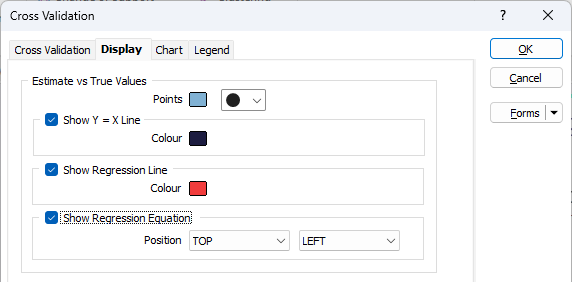
On the Display tab of the Stats | Variography | Cross Validation form, you can now choose to include a Regression Line and a Regression Equation on the True vs Estimate Chart:
Regression line stats are also shown in the Properties Pane:
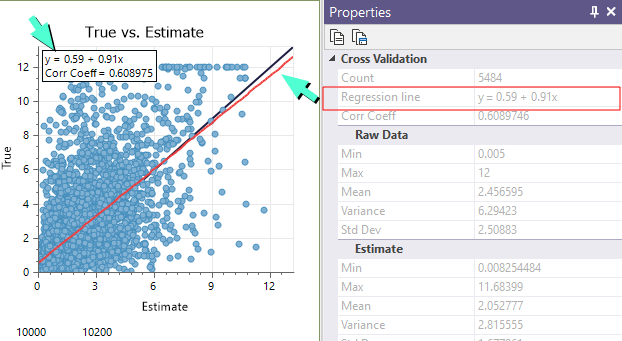
The option to calculate the values along the X axis and Y axis in a natural logarithmic range has also been added.