Chart Tools
When you generate a chart, the following tools and options are common to most charts:
Interact with the chart
Zooming and panning within a chart relies on the middle mouse wheel button:
- To zoom in or out: roll the mouse wheel towards or away from you
- To zoom the X-axis only: roll the mouse wheel whist holding the Ctrl key
- To zoom the Y-axis only: roll the mouse whilst holding the Shift key
- To pan the chart (when zoomed in): drag with the middle mouse button
History
When you right-click in a chart, a context menu lets you choose from a History of recently-used functions (when you select Variograms on the Stats tab, in the Variography group, an additional Add component here option is also available).
If a tool is active (i.e. Panning), right-clicking in the Chart window will deactivate any active tools. Right-click again to view the context menu.
Chart
On the Chart tab, in the Chart group:
- Click the Form button to open the form associated with the generated chart.
- Click Refresh to refresh the chart. This may be necessary when changes have been made to the underlying data.
- Click Print to send an image of the chart to a printer. The chart will be re-scaled so that a best-fit of the page is achieved, while still maintaining the aspect ratio.
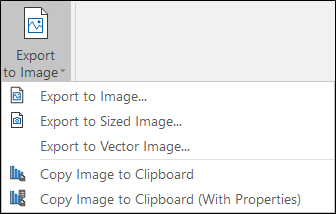
- Click Export to export the chart as an image.
![]()
![]()
![]()
You can also select Print Setup from the menu, to change Printer and Print Setup options:
![]()
![]()
Alternatively, select an Export option from the menu. See: Export the Chart:
Decorate
On the Chart tab, in the Decorate group:
- If properties are supported for the type of chart being created, click Show Properties Table to show properties on the chart itself. Options that determine the position and the width of the Properties pane are provided.
- Click Show Legend to display a legend on the chart. See: Legend
![]()
![]()
Select
On the Chart tab, in the Select group:
- Click Select to interact with some charts. Use the mouse wheel to zoom (Hold CTRL for X-zoom, hold SHIFT for Y-zoom). If the chart is zoomed. you can also click and hold the middle mouse button to pan the chart.
![]()
- On some types of chart, you can also select a Lasso selection tool from the menu:
![]()
Pan
On the Chart tab, in the Select group:
- Click Pan to interact with some graphs. When the chart is zoomed, you can then click and drag the mouse to view the whole chart by panning along the X and Y axes.
![]()
When the chart is zoomed and not visible, or only partially visible, you can also click and drag the scroll bars shown on each axis:
Box Zoom
On the Chart tab, in the Select group:
-
Click Box Zoom and draw a rectangle around a part of the chart to which you want to zoom in. You can repeat the procedure to zoom in further.

The Box Zoom tool is only available for charts that allow zoom, such as Scattergrams and Multi-Purpose Charts.
Data
On the Chart tab, in the Data group:
- If applicable, click Save to File to save current changes to the underlying data file.
- Click Input File to open the input file alongside the chart. You can use the Sync Selection options on the Chart toolbar to synchronise data selections in Vizex or the File Editor. See "Sync" below.
- Use the Output/Report File option to open the report (.rpt ) file for the chart in the File Editor.

- Use the options on the Sync tool menu to synchronise selections between the chart and a Vizex layer or the File Editor.
![]()
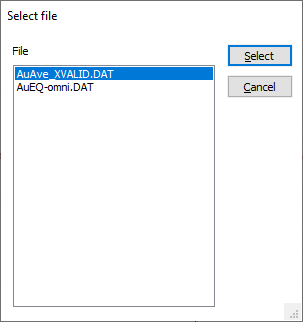
When a chart is open and multiple files are referenced by the chart, you are given the option to select the file you want to open:
|
|
|
![]()
| Description | |
|---|---|
|
|
None: Sync Selection options for the displayed data are turned off. Selections are not being sent or received. |
|
|
Send: When data selections are changed and Sync Selection Send is enabled, those selections are sent if the same data is open in another synced view. |
|
|
Receive: When someone else has changed the data selection in another synced view and Sync Selection Receive is enabled, the selections in the current view are updated. |
|
|
Both: Sync options for the displayed data are turned on. The current view is sending selections out and receiving selections in. |
Annotations
If annotations are supported, on the Chart tab, in the Annotations group:
- Click the Create Point tool to add a Point chart annotation
![]()
- Click the Create Label tool to add a Label chart annotation.
![]()
- Click the Create Line tool to add a Line chart annotation.
![]()
- Click the Create Horizontal Line tool to add a Horizontal Line chart annotation.
![]()
- Click the Create Vertical Line tool to add a Vertical Line chart annotation.
![]()
- Select a Chart Annotation Style from the styles defined in the form. Annotations created interactively will use this style:

- Click Clear All to clear all annotations.
![]()
- Click Move to move the selected annotation(s) to a new position with the mouse and then click to drop into position.
![]()
Panes
On the Chart tab, in the Panes group:
- Click Properties to show or hide the Properties Pane of the chart.
![]()
Help
On the Chart tab, in the Help group:
- Click Help to view an online help topic for this chart.
![]()