Advanced
Axis Range
In the Advanced Options dialog, select the Axis Range check box to define the range of each axis on the chart.
The Minimum and Maximum data values you define here only affect the range of the axis and do not affect the range of the data that is processed.
You cannot set the major increment and minor count for a logarithmic axis (which has its own custom labels).
On a qualitative axis (strings rather than numbers) the default major increment is 1 (label every one). If you set the major increment to 2, for example, this will label every second one, and so on.
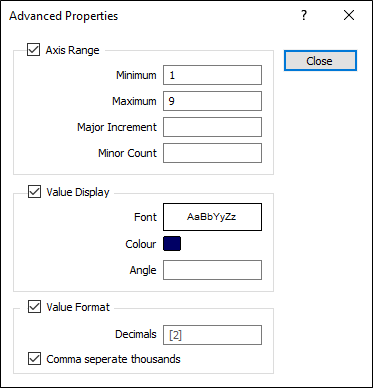
Minimum
Enter the minimum value that will be shown on the axis.
Maximum
Enter the maximum value that will be shown on the axis.
Major Increment
Enter an increment value that determines the frequency of the labels along the axis.
Minor Count
Enter a count value that determines the number of tics displayed between the labelled increments.
Value Display
Select the Value Display check box to customise the font used to display values along the axes.
Font
When you hover the mouse over the Font icon a preview of the current or the default font setting is shown:
Colour
Double click on the Colour icon to set the font colour.
Angle
Enter a value to display the value text at an angle. The default angle (zero) is perpendicular to the axis. A value of 90° will display the text rotated 90° in a clockwise direction.
Value Format
Select the Value Format check box to customise the way in which numeric display values are formatted.
Decimals
Specify a decimal precision or accept the default (2 decimal places).
Comma separate thousands
Select this check box to delimit multiples of a thousand with a comma.