Output
Select one or more of the following output options:
Points file
Select the check box and enter (or double-click to select) the name of a Points file. The interpolated points generated by the process will be written to this file. Select the Append input points in output file option to also include the original sample points as spot heights.

Grid file
Select the check box and enter (or double-click to select) the name of a Grid file. The output generated by the process will be written this file.
Select the Auto load check box to automatically load the grid in Vizex. You can also specify how the grid will be colour-coded.
Double click (F3) to select the Colour set and the Default colour that will be used to control the display colour. The colour set maps colours to text strings or numeric ranges. Right click (F4) to create or edit a colour set. The Default colour will be used when a colour set is not defined.

Wireframe
Select the check box and select an option to determine whether an output wireframe is created using the temporary grid, the interpolated points, or the interpolated points and the input points:
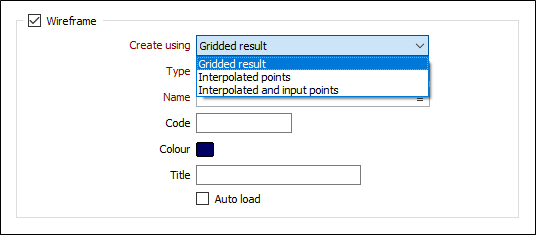
Double-click to set the Type and then the Name of the wireframe that will be generated as a result of the process.
You can optionally specify a Code attribute, an output Colour for the wireframe, and a Title that will help identify the wireframe.
Select the Auto load check box to automatically load the wireframe in Vizex. The default draw style for an auto-loaded wireframe is 3D Shaded.
Forms
Click the Forms button to select and open a saved form set, or if a form set has been loaded, save the current form set.
Run
When you have set input and output parameters and defined the grid limits, click Run to begin the interpolation.