Statistics
This
Show Planes in Vizex
A new Show Planes in Vizex tool on the Chart | Variogram Map tab, in the Variogram Map group , displays a 2D ellipse showing the current variogram direction in Vizex.
![]()
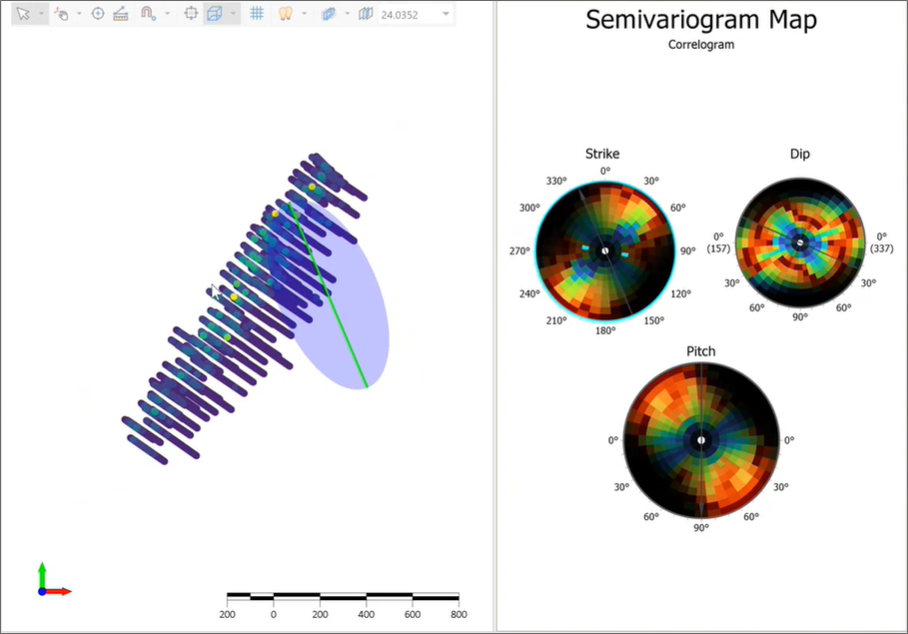
The display lines up with the orientation selected in the variogram map and can be rotated and adjusted to assist you in validating directions with relation to samples - incorporating geology and other elements and making sure the directions make sense in 3D space.
Weight Cell on Pair Count
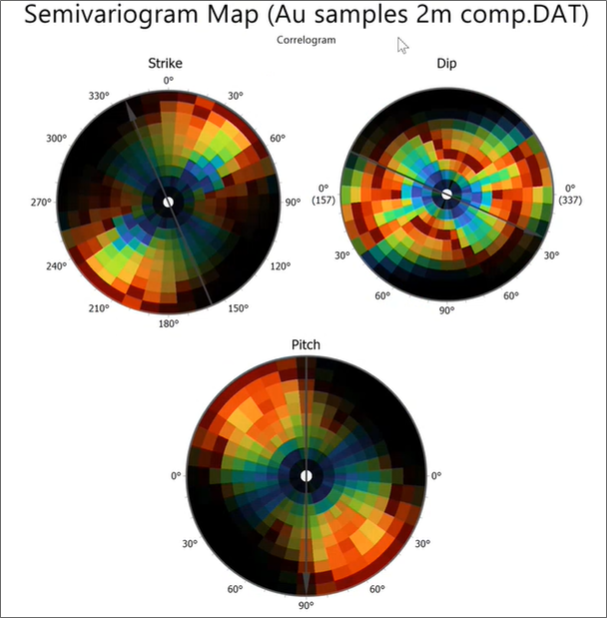
A Weight cells based on pair count option has been added to the Display Options on the Input Data tab of the Semi Variogram Map form. This new option will weight each cell by the count of pairs that contribute to it, and fade to the colour set for the Empty colour as the count approaches zero.
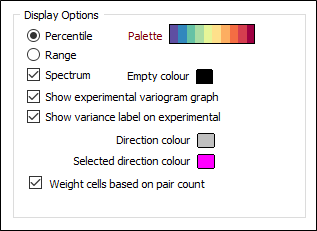
Where there are less pairs, the greater the transparency. So if the empty colour is set to black, for example, the variogram maps will provide a clearer sense of where there is no data:
Geological Plane Rotations
A new Geological Plane Rotations button, on the Input Data tab of the Semi Variogram Map form, can be used to view or edit the parameters used to set the orientation of the map plane.
Fill from Working Plane
A new Fill From Working Plane button, on the Input Data tab of the Semi Variogram Map form, can be used to quickly set the orientation of the map plane to match the current Vizex Working Plane:
Dynamic Maps
The chart layout is now dynamic, with the maps scaling according to the available space in the window. Directions are now all the same colour, with the exception of the primary direction - and these colours are defined by the user in the form set.Maps can be selected in Summary View and used by the Align Vizex tool, and the Vizex Plane shape.
The selection of Direction on the Variogram Map has been improved, with direction snapping enabled by default and an arrow displayed for the selected direction.
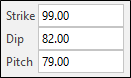
Strike, Dip and Pitch
You can now update the orientation of the variogram maps when the chart is open, by entering Strike, Dip and Pitch inputs on the Semi Variogram Map ribbon:
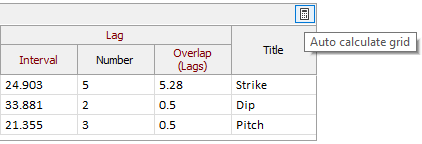
Processing Options
The Auto calculate grid button, above the Processing Options grid on the Input tab of the Variogram Map form, now calculates the Lag values for all three maps.
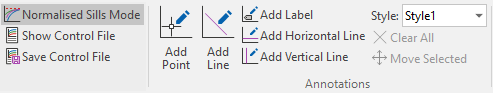
Normalised Sills Mode
Variogram parameters are now normalised relative to 1 when Normalised Sills Mode is active. These parameters, such as nugget (proportion of the sill), can then be used in other normalised charts such as Correlograms.
Note that Normalised Sills Mode is automatically turned off when a normalised model form set is saved and then subsequently loaded.
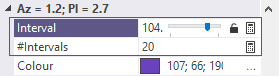
Lag Interval Lock
When the Variogram Chart is open, a Lock icon can now be clicked to prevent the inadvertent adjustment of the Lag Interval while browsing Properties.
![]()
![]()
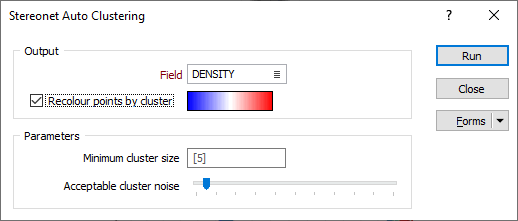
Stereonet Auto Clustering
An Auto Clustering tool has been added to the Stereonet ribbon which enables the automatic clustering of points in the Stereonet based on their density.
![]()
Swath Plot
Count and Frequency Y-axis options are now available for selection on the Appearance tab of the Swath Plot form. If no weighting is used, Count is the Frequency of the values as a percentage of the file total count. If weighting is used, then the Frequency represents the sum of the weights as a proportion of the sum of the file weights.

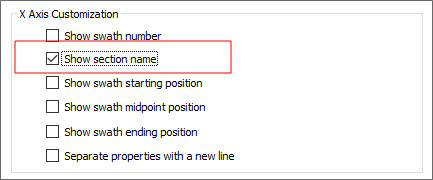
When Swath mode is set to Section control file, it is now possible to show each Section Name by selecting that option in the X Axis Customisation and the Value Point Label Customisation groups on the Appearance tab of the Swath Plot form:
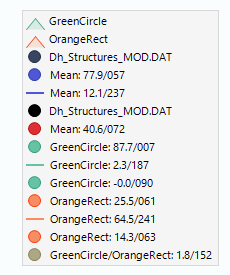
Stereonet Legend
New check box options on the Legend tab of the Stereonet form allow you to choose which Data and Group Mean statistics to show on the legend, including Group Mean plane orientations:
Dynamic Multi-Graph Charts
Support has been added for dynamic layout in multi-graph charts, Multi-graph chart layouts now dynamically scale as the frame is resized, rather than remaining static within the frame.
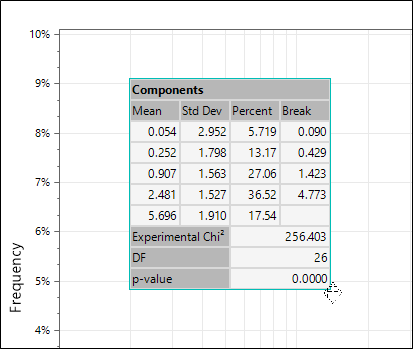
Move Histogram Analysis Results
The Histogram Analysis Result box can now be moved within the chart window by drag/drop. When moved, the position of the box will be reset if the chart is refreshed, or when the Analysis Result display is toggled off and back on.