Statistics
This
Summary View
A Summary View button has been added on the Chart | Variogram Map tab, in the Variogram Map group. This allows you to view maps for Strike, Dip and Pitch all together, as an alternative to navigating each view using Previous View and Next View options on the ribbon.
![]()
The Summary View button will not be enabled if the three angles are not defined.
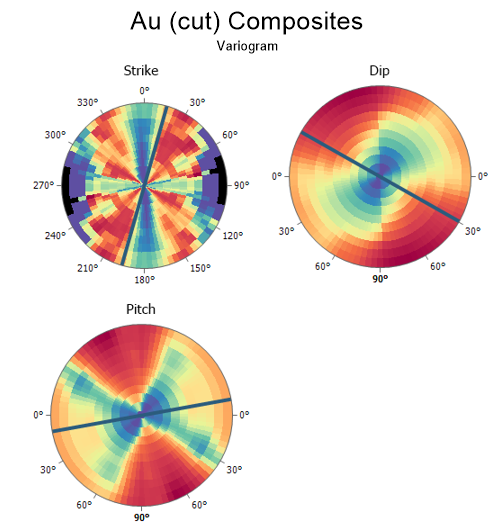
In the Summary View, you can then double-click on one of the maps to quickly switch to that individual (Strike, Dip, or Pitch) view.
Variogram Control File Viewer
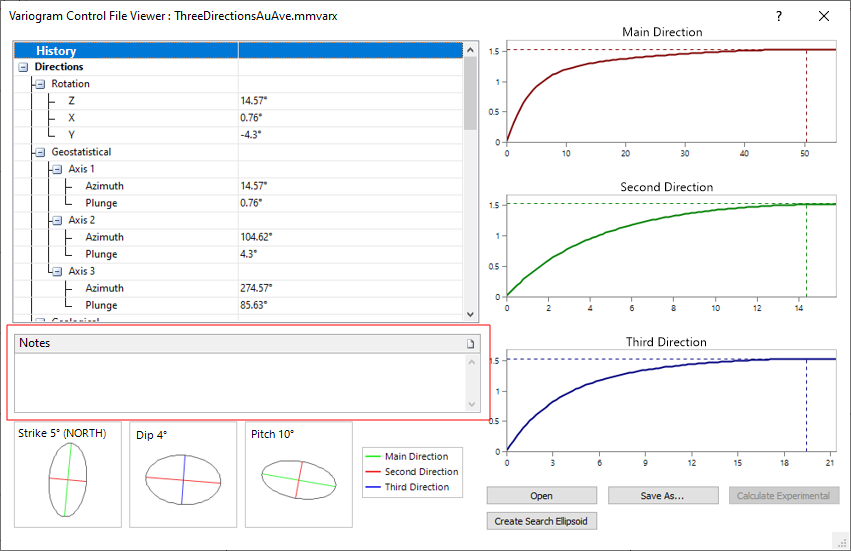
On the Stats tab, in the Variography group, when you click Show Control File to open and view a Variogram Control File for inspection, you can now add notes for that Variogram Control File. The notes are saved automatically when you exit the Viewer.
Outliers Transparency
A Transparency slider has been added to the Outliers group on the Display tab of the Box and Whisker form. The slider controls the visual transparency of outlier points in the plot display.
Outlier Labels
A Show Label option has been added to the Shewhart Control Chart to allow the display of labels for outlier points - points which fail the Nelson Rules configured for the chart.
By default, when the label field is blank ([Auto]), the failed rule numbers will be shown in the label. Alternatively, double-click to select the name of a field (typically, sample or hole number or sample batch number) that contains label values.
Note: Labels are allowed when the Group By settings on the Input Data tab are used, however only failed rule numbers are labelled and the Label field is disabled.

Summary Statistics
On the Stats tab, in the Exploratory Data Analysis group, when you click Box and Whisker to visually summarise and compare the distribution of values of multiple variables, when Summary Statistics for a selected box are displayed, the precision is now taken from the precision of the data fields in the input file.
Note that this does not affect the precision of stats which are not in the same scale as the data, such as COV and Confidence, etc. The values in those field values are formatted using significant figures.
Plot Scaling Improvements
Box and whisker plots usability with high DPI screens has been improved. The one pixel wide box borders will now be better visible at high resolutions. The thickness of the median line and the whisker lines will also scale. This improvement affects the main box and whisker chart, and the box and whisker display mode in Boundary Analysis.
Boundary Analysis Display
A range of display options has been added to the Boundary Analysis Chart. Users can now select the display of;
-
Mean Grade: with options for point marker shape and line style.
-
Grade Box and Whisker: with shape and transparency options, as well as Outliers display.
-
Points: show all the raw data points on the chart with options for point marker shape and transparency.
-
Count: display bars and select a colour.
-
Labels: show numerical counts at the top of the chart, for each distance bin. Options to show the border, and configure font properties.
-
Domain Labels: options for count labels, plus enable a border and configure font properties.
-
Data Table: display a table of the data for the chart in Simple or Detailed mode.

Box Zoom Tool
The Box Zoom tool has been added to the common chart tools for chart types that allow zooming. The tool allows you to draw a rectangle around an area of the chart into which you want to zoom. The process can be repeated to zoom in further up to the supported zoom level.

Multiple Axes / Groups
Axis and Group settings now supported for variables when tabulating Display per-box statistics statistics in a Box and Whisker plot.
Data Analysis Report File Output
A Report File option has been added to the Input tab of the Box and Whisker and the Q-Q Plot forms. The option is used to select the name of the Report File that will be written as a result of the process.
The Box and Whisker report will output statistics for each box, such as Count, Min, Max, Mean and Std Dev. The Q-Q Plot report outputs the information that is shown in the Properties pane, structured with a Label/Value layout.
The generated Report files for both forms will set the display precision according to the input data precision.
Data Annotations
After selecting the Data Annotations | Move tool, rather than click the position on the chart where an annotation should be moved to, you can now move the annotation to a new position with the mouse and then click to drop it into position.
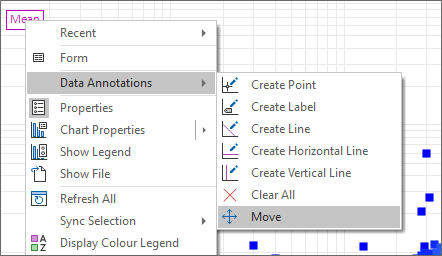
Note that you can still hold down the CTRL key to move a copy of the annotation instead.
Output/Report File Tool
The Output/Report File option has been added to the tools on the Charts context ribbon. The new tool will be enabled for charts that have written a report or output file. If there are multiple files that can be opened, a file selection list will show so you can select the report to display.