Определить границы зон разломов
Your understanding of the geology has probably given you some indication of where faulting occurs. The following process may help to confirm fault locations.
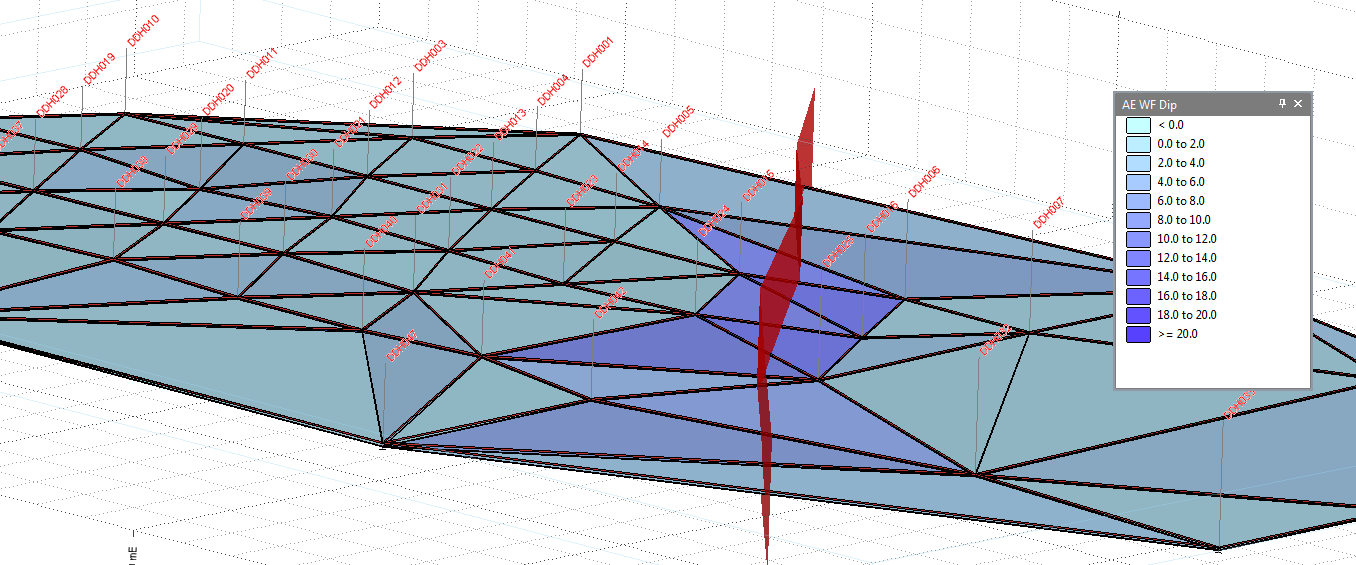
Create a DTM of the Roof (or Floor) of the AE Seam and then display it in Vizex, colour coding based on triangle Dip. The more steeply dipping triangles give a visual indication as to the location of the fault.
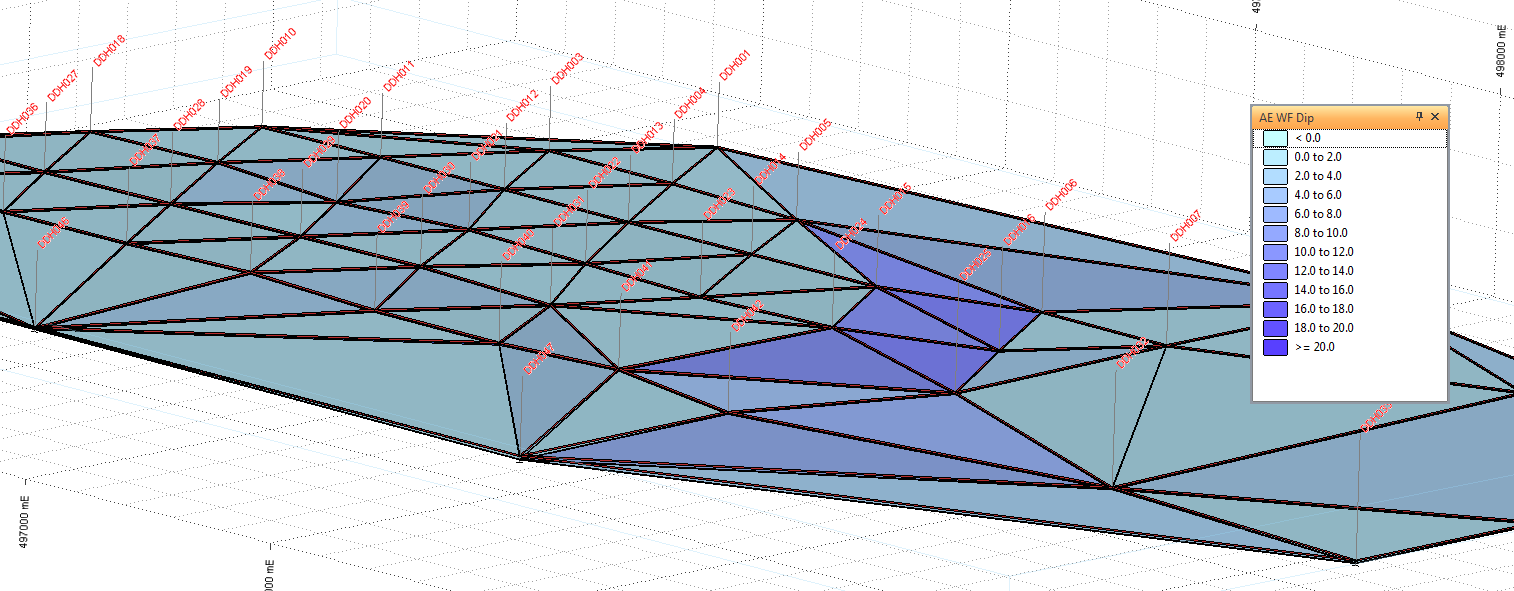
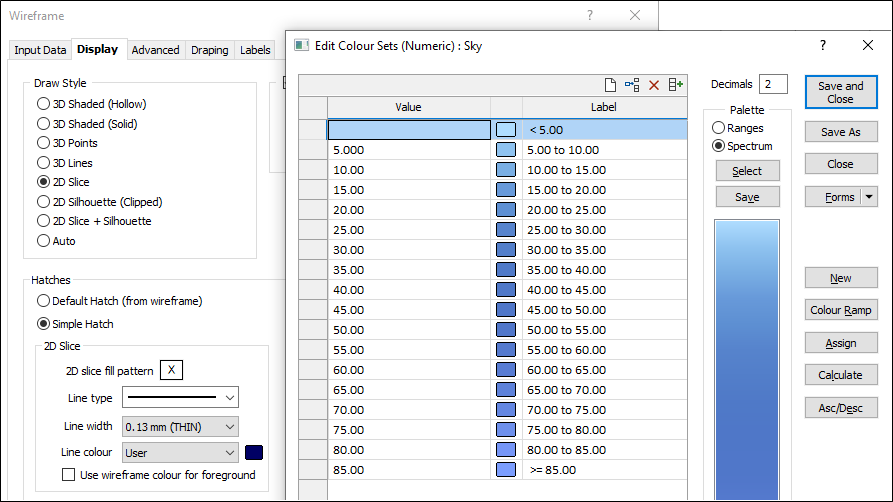
The same Seam file used in the gridding process can be used as the input to the Grid/DTM | Grid Create | New Grid function. Filter on the seam of interest. When displaying the resultant DTM in Vizex, colour code the triangles based on their DIP.
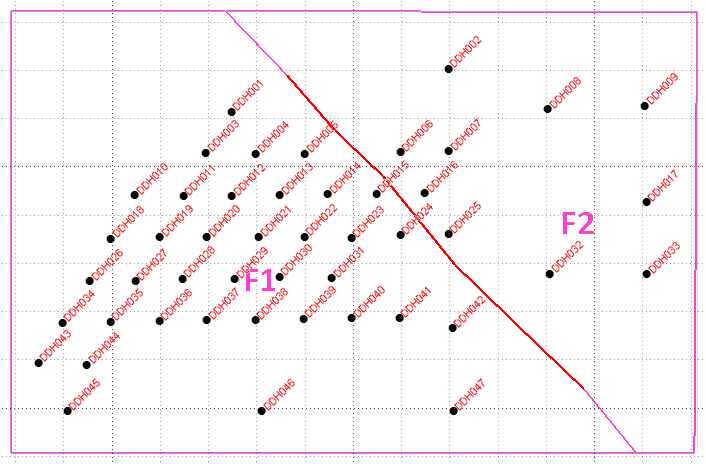
The screen shot above shows the fault plane location. When we grid the seam elevation it is necessary to model it independently on either side of the fault. The gridding function has provision for this, but requires the fault ‘zones’ to be closed shapes. To satisfy this, we need to digitise polygons similar to those shown in the screen shot below.