Assign
The Assign function used with numeric sets automatically divides your data into a specified number of ranges based upon the minimum and maximum values of a nominated field and the calculation mode you have chosen. A histogram shows the ranges and a count of the values in each range bin.
Click on the Assign button in the Numeric Sets form to display the Assign dialog.
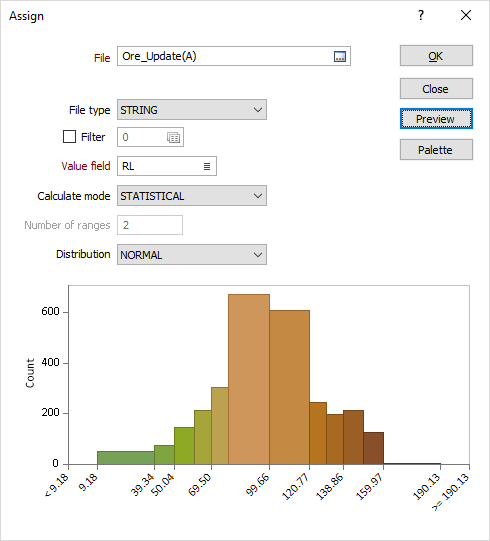
File
Select a file type and enter (or double-click to select) the name of the file containing the values you wish to base numeric ranges on. Optionally apply a filter to limit what data is retrieved by the Assign process.
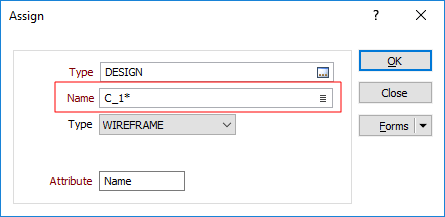
Name
If you selected WIREFRAME SET as the file type, the Name input will be enabled. Click on the Forms icon to select the name of a wireframe set.
If you selected WIREFRAME as the file type, the Name input will be enabled. Double-click (or click on the List icon) to select the name of a wireframe of the specified type. Wildcards and a partial name in the Name input box may be used to select multiple wireframes. See: Wildcards
File Type
Select a file type from the drop-down list. In addition to Micromine data files (including ODBC and MDB linked files), you can select a generic CAD/GIS option (which includes proprietary file types such as Map Info, Arcview, and Microstation etc.). You can also specify a WIREFRAME type. Each wireframe type is stored in its own triangulation database (*.tridb) file.
Value field
Double-click to select the field in the file that contains the numeric values you want to use.
Calculation mode
Choose the mode of calculation:
| Mode | Description |
|---|---|
|
RANGES |
The data will be divided into equal ranges. |
|
PERCENTILE |
The program will divide the data into ranges each containing the same number of values; the highest and lowest value in each bin will define the upper and lower values for each range. |
|
STATISTICAL |
If you select Statistical assignment in colour numeric sets, the mean and standard deviation of the data are calculated and 12 ranges established. |
|
JENKS |
A data clustering method is used to divide the data into ranges. The method seeks to reduce the variance within each range and maximise the variance between the ranges. |
Number of ranges
Enter the number of ranges you want to divide the data into.
A row number column (the left-most column in the grid list) makes it easier to determine the number of ranges in a set. The first and last row numbers in each list are left blank because they represent open-ended ranges that do not apply to the Assign process.
When you choose STATISTICAL for the mode of calculation, the number of ranges is fixed at 12. In this case, the Number of ranges prompt is disabled.
Distribution
If you choose STATISTICAL as the mode of calculation, the Distribution list is enabled. If you set this to LOG NORMAL, the natural logs of the values will be taken before they are distributed into the 12 unequal ranges. See: Log-normal limits
Setting it to NORMAL will mean that the raw values are used. See: Normal Limits
OK
When you click OK, the Assign process will divide your data into the specified number of ranges using the calculation mode you have selected. Allocate a colour, hatch, line, or symbol to each range in the numeric set.