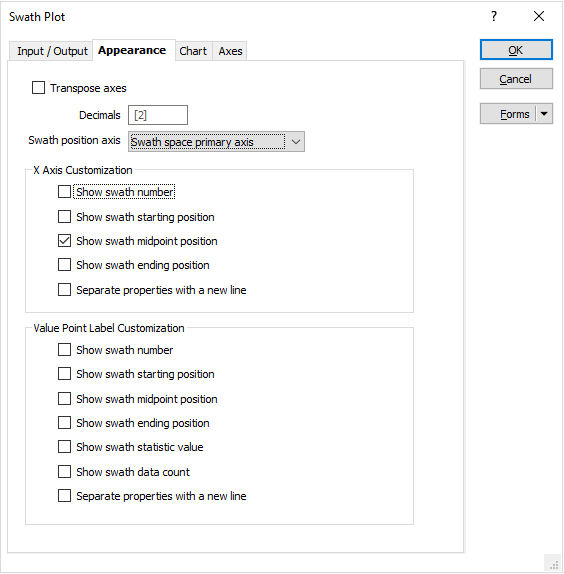
Appearance
Use the Appearance tab of the Swath Plot form to customise the appearance of the labels around each value point, and along the X axis. An option to transpose the axes is also provided.
Transpose axes
Select this option to transpose the X and Y axes on the graph. This is useful when doing swaths against RL, for example, to provide a visual comparison against the data.
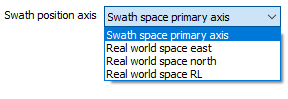
Swath position axis
Enter the number of decimal places and choose a position axis.
Swath position axis refers to the position values plotted on the graph. For example, if you have selected “Use as orientation base” to align the swath axis with a block model, you may still prefer to display the swath information using the real-world X axis position.
X Axis Customisation
Select the check boxes to choose what to show along the X axis of the plot.
Value Point Label Customisation
Select the check boxes to choose what to show for each value point on the plot.