Raster Calculator
![]()
Input Raster Bands
Select the grid surfaces you want to load and use in the calculation of new raster layers. Use the buttons on the grid list toolbar to Manage the rows in the list.
Calculate Expression
Dynamic expressions containing arithmetic operators, numeric and character constants, and trigonometric functions, etc, can be used to perform calculations on the raster cells in a grid surface file.
Raster-specific expression variables may also be used to create a parametric grid:
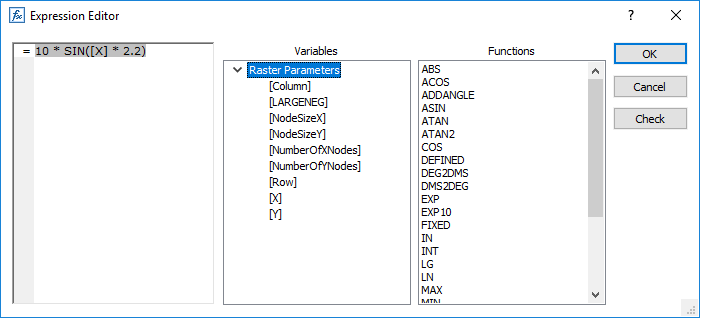
To open the Expression Editor, right click anywhere in the Calculation Expression pane. For more information, see: Expression Editor
Output File
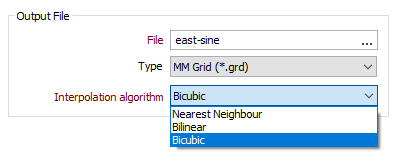
File
Double-click to select the name of the Grid file you created in the Contours function.
Interpolation algorithm
Interpolation algorithms can be applied to improve the precision of the generated Z values in the grid. There are 3 options:
| Algorithm | Description |
|---|---|
| Nearest Neighbour | Selects the value of the nearest point. |
| Bilinear | Performs a linear interpolation on a 1-by-1 grid around the point, first in one direction, and then the other. |
|
A Bilinear interpolation will generate Z values that closely match the height of the grid when it is displayed in 3D Shaded mode. |
|
| Bicubic | Uses cubic splines to interpolate a 4-by-4 grid around the point. This algorithm will produce a better result than Bilinear, at the expense of processing speed. If one of the Bicubic nodes is undefined or lies on the boundary, the function will attempt to apply the Bilinear algorithm, or failing that, Nearest Neighbour. |
|
Under some circumstances a Bicubic interpolation can overshoot the original data and this may cause data artefacts. Always validate Bicubic interpolation results before using them elsewhere in Micromine. |
Output Grid Limits
The Output Grid Limits display the min/max values of the selected input grid, which should remain visible if the user then changes to Manual mode. This will make it easier for users to adjust the new grid to their requirements, rather than having to enter all of the values from scratch
The limits of the output grid can be defined in one of the following ways:
From Input File
Select this option to set the Minimum and MaximumX and Y extents and the Cell Size of the output grid to match the extents and the cell size of the source input grid you have chosen. If the extents of the input grid do not cover the entire output extents, they will be extrapolated.
Manually
When you select this option, the extents and the cell size of the source input grid can be edited, allowing you to manually set the Minimum and MaximumX and Y extents and the Cell Size of the output grid. If the extents do not cover the entire output extents, they will be extrapolated.
Selecting a new Input file will have no effect on the extents of the output grid.
Full Extent
The full rectangular extent of all grids. If the extents do not cover the entire output extents, they will be extrapolated.
Accept the default Cell Size or enter a new value.
Union
The exact extent of all input grids; null cells may be created.
Accept the default Cell Size or enter a new value.
Intersection
The intersection of the input grids (the exact extent of all overlapping grids; no null cells; no extrapolation).
Accept the default Cell Size or enter a new value.
Forms
Click the Forms button to select and open a saved form set, or if a form set has been loaded, save the current form set.
Run
Finally, click the Run button to run the function.