Configure an XY Chart
To add an XY Chart to the current configuration:
- In the Configuration Manager, right-click on the User Interface | Sample Tracker | Charts | XY Charts node of the navigation tree and select the New | XY Chart option from the menu.

- Enter the general properties (Name, Description) of the chart you are creating
- If you need to prompt the user for values when running queries, substitution parameters can be inserted. See: Substitution Parameters
- To configure input file and output options for the chart, click on the Configuration tab.
- To configure the messages to be shown, or the scripts to be executed, when the task form is opened or closed, click on the Events tab.
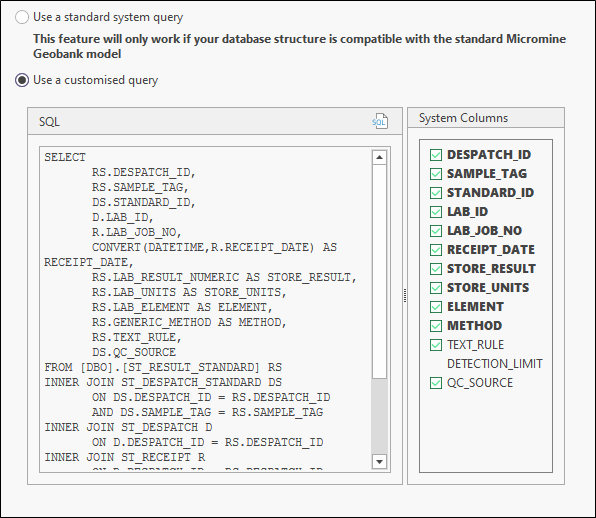
Data
On the Data tab of the Property Editor, choose whether to use a standard system query or use a customised query (recommended) to retrieve the data for the chart.
Runtime Options
The Runtime Options page provides advanced reporting options that allow you to modify the point shape, include the result in the report, and modify the number of decimal places used to report the values.
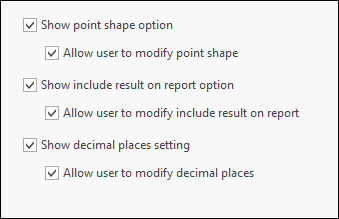
Show point shape option
Select this option to show a point shape control on the chart. Select Allow user to modify point shape to make the point shape editable.
Show include result on report option
Select this option to include the result on the report. Select Allow user to include result on report to make the inclusion option editable.
Show decimal places setting
Select this option to show a decimal places control on the report. Select Allow user to modify decimal places to make the number of decimal places editable.
Show square chart setting
Select this option to show a square chart option on the chart. Select Allow user to modify square chart to make the square chart option editable.
Show logarithmic axes setting
Select this option to show logarithmic axis options on the chart. Select Allow user to set axes logarithmic to make the logarithmic options editable.
On the Report Options tab of the Chart Property Editor, you have the option to generate a default (HTML) report or generate an Advanced Report that has already been configured.
Report Type
Choose the type of report you want to generate:
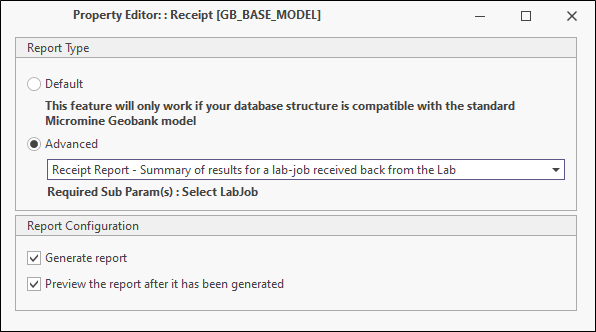
Default
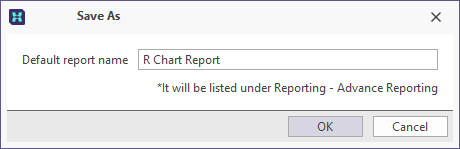
Select this option to create a HTML report. To save the report and give it a name other than “default” click the Save Default Report As button. The report will be saved as part of the configuration and listed under User Interface | Reporting | Advanced Reports.
Advanced
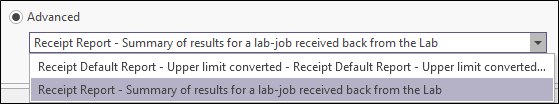
Select this option to use an Advanced Report, Graphic Report or HTML Report that has already been configured. See Advanced Reports Fundamentals
Use the drop-down menu to select the report you want to use:
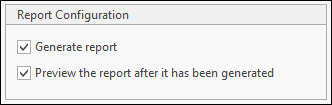
Report Configuration
Choose whether to generate a report. If the Generate report check box is selected, you can select an option to preview the report after it has been generated.
If you choose not to preview the report, you can print the report or export to PDF.