Simple Grouping
Grouping allows you to split data into groups based on data with identical values in one or more fields.
The easiest way to group data is to use the Group and Sort panel. The following procedure shows how to create groups of SITE_ID's based on records having the same value for the PROJECT field. The PROJECT fields are then sorted in Descending alphabetic order.
- Open a new Advanced Report, set the Data Set, Select Layout and click on the Launch Designer icon to open the Report Designer.
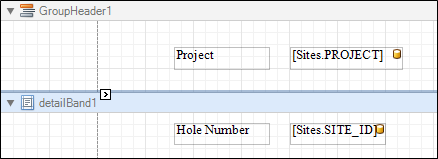
- Drag a label onto the GroupHeader1 band and change its contents to "Project".
- Drag the PROJECT field from the Field List and place it next to the Project Label.
- Drag a label onto the detailBand1 band and change its contents to "Hole Number"
- Drag the SITE_ID field from the Field List and place it next to the Hole Number Label.
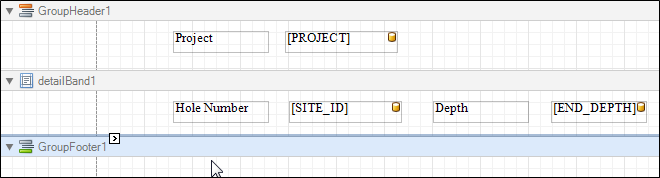
The report layout should look like the following:
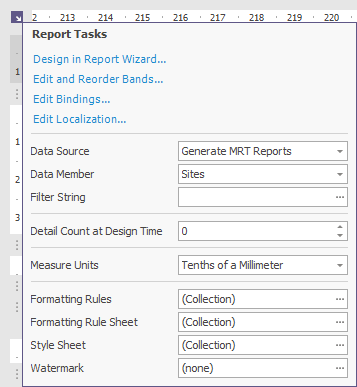
- Click on the Report's smart tag and add Sites to the Data Member field.
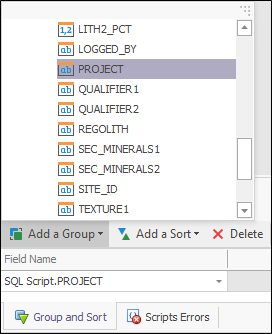
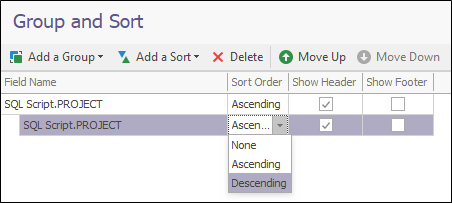
- In the Group and Sort panel, click Add a Group and select the PROJECT field from the pop-up list.
- Set the Sort Order to Descending using the drop-down list.
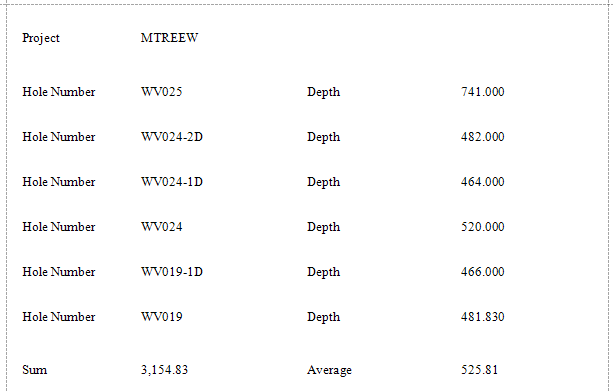
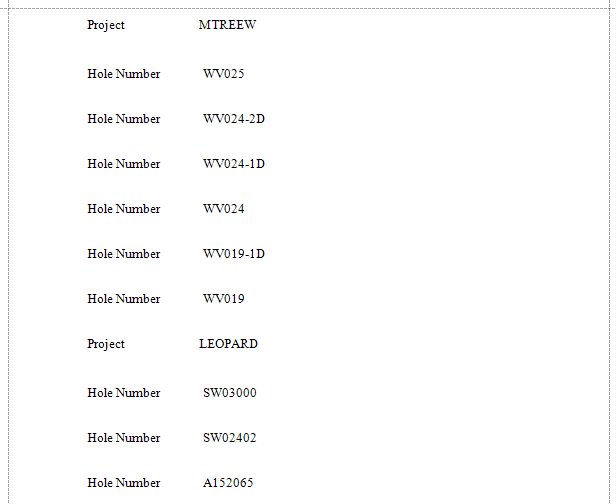
The first page of the report shows the data grouped by PROJECT and will look as follows:
Summary Statistics
Now you will add Hole Depths and calculate some summary statistics for each PROJECT.
- Drag a label into the detailBand1 band and change its contents to "Depth".
- Drag the END_DEPTH field from the Field List and place it next to the label on detailBand1.
- On the GroupFooter1 band, drag a label and change its contents to SUM.
- Drag the END_DEPTH field from the Field List and select the field.
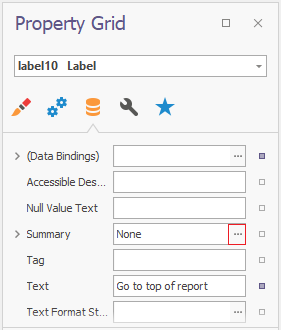
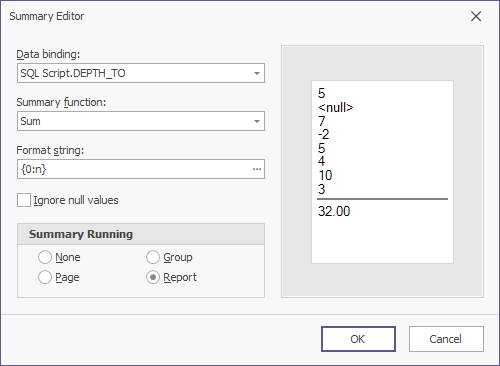
- In the Label Property Grid, select Data | Summary and clip on the ellipsis (...) to open the Summary Editor.
- In the Summary Editor, select Sum from the Summary function drop-down list and select an integer format from the Format string. Select Group from the Summary running radio buttons. Click OK.
- On the GroupFooter1 band, drag a label and change its contents to AVERAGE.
- Drag the END_DEPTH field from the Field List and select the field.
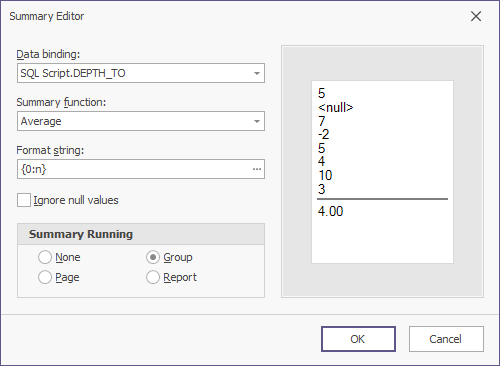
- In the Label Property Grid, select Data | Summary and click on the ellipsis (...) to open the Summary Editor.
- In the Summary Editor, select Average from the Summary function drop-down list and select an integer format from the Format string. Select Group from the Summary Running radio buttons. Click OK.
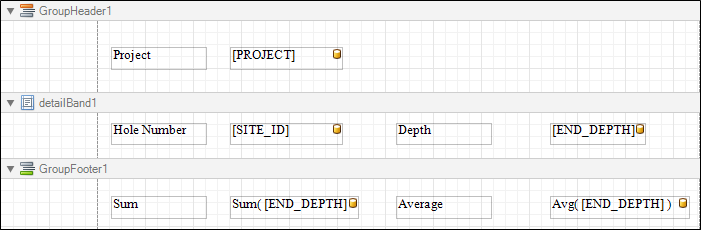
The final report layout looks as follows:
- Click on the Print Preview tab.
The first part of the report's output looks as follows: