Report Bands
Every report in Advanced Reports is a banded report. This means that a typical report consists of a number of bands, each of a different type. Every band may contain report controls.
What is a Band?
A Band represents a specific area in a report. Controls added to a Band can be given attributes that relate to that Band.
Band Types
When a new blank report is created it looks similar to the image shown below. The report's area is initially divided into four basic bands (Report Header, Page Header, Detail and Page Footer bands).
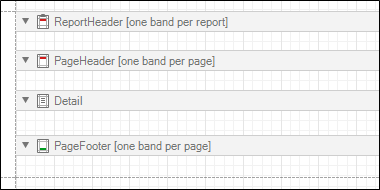
A particular band type specifies how the controls located on this band are rendered, their rendering order and how many times they are rendered (in the case of a data-bound report). In the Report Designer, some of the band strips may display tips with information on how bands will be rendered. For instance, for the Page Header and Page Footer bands, the "one band per page" tip is displayed.
When you are creating a particular report, you can add or remove any bands.
The table below lists the available band types:
| Top Margin | is located on the top of every page, above the Page Header Band or Report Header Band. |
| Report Header | is located at the beginning of a report. This band is intended to display some introductory information, e.g. a cover page for a report. |
| Page Header | is located at the top of every page, below the Top Margin Band or Report Header Band. This band is intended to display page numbers or a table header, continued from the previous page. |
| Group Header | is located at the beginning of every group or at the top of the page in case it is split across pages. This band specifies grouping criteria and is used to display information at the beginning of a group of records. |
| Detail | is located on a page between all other bands. This band displays a single record (from the bound dataset) at a time, or simply holds unbound controls if there is no dataset assigned. |
| Group Footer | is located at the end of every group or at the bottom of the page if its group is split across pages. This band is primarily intended to show summary information for a group. |
| Report Footer | is located at the end of a report. This band is intended to display some final information, e.g. report totals. Note: report totals can also be shown in the Report Header. |
| Page Footer | is located at the bottom of every page, below the Report Footer Band and above the Bottom Margin Band. This band is intended to display page numbers or a table footer, which is continued on the following page. |
| Bottom Margin | is located at the bottom margin of every page, below the Page Footer Band. |
The following image illustrates the relative positions of different band types, and how many times they are rendered in a report.
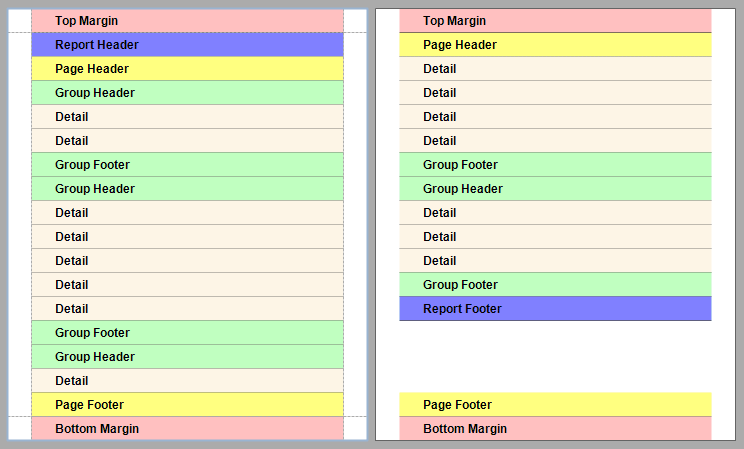
The Page Header, Page Footer, Top Margin and Bottom Margin bands are rendered in the report on every page.
The Report Header and Report Footer bands are rendered in the report only once.
The Group Header and Group Footer bands are rendered for every group of records in a report.
The number of times the Detail band is rendered in a report depends upon the number of records returned from the bound dataset - one band per record.
Editing Bands Method 1
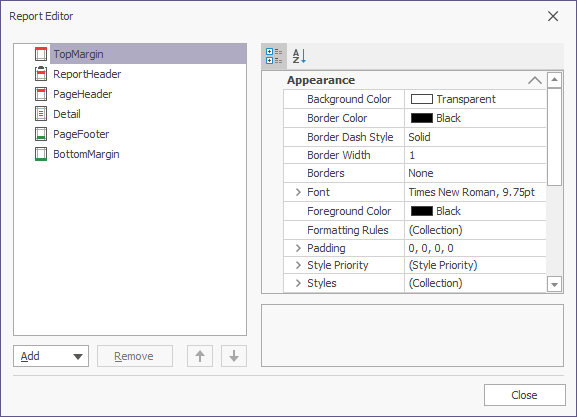
Select a report, right-click in a margin of the report outside of the grids and select Properties. This will take you to the Property Grid pane. Select the Miscellaneous tab (shown by a spanner) and click the ellipsis button (...) for the Bands property.
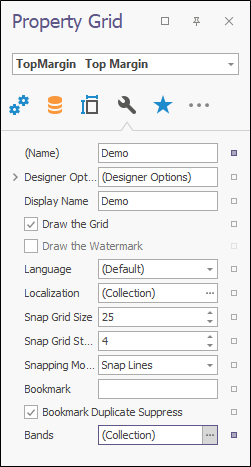
This will invoke the Report Editor dialogue, which displays a hierarchical tree of report bands and is intended for adding or removing bands, as well as editing their public properties.
Editing Bands Method 2
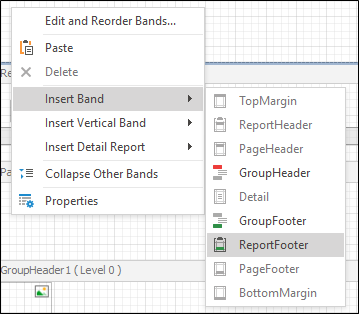
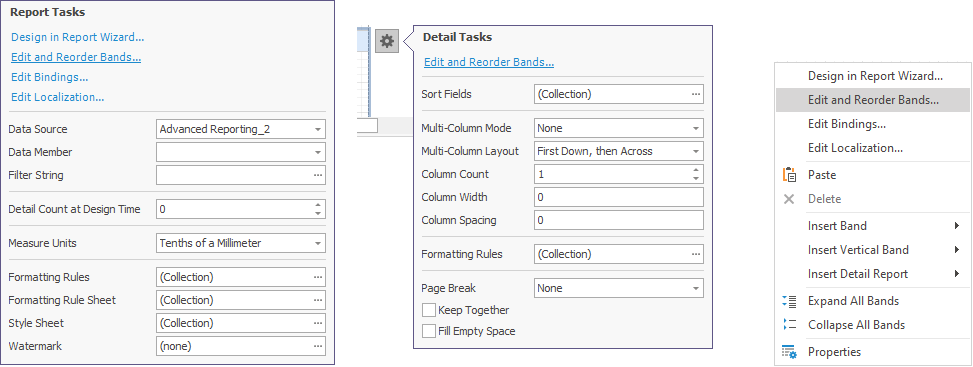
Another way to invoke the Report Editor dialogue is to choose the Edit and Reorder Bands... option. This is available in a few places: the report's main Smart Tag, the Smart Tag of any Band or by right-clicking anywhere on the report (all shown in the image below).
Editing Bands Method 3
Right-click to add a new band of a particular type, using the report's context menu.