Connecting with Reports
Where a Connector control is available in a related Data View and Graphic Report, the data in the grid and elements of the report can be connected.
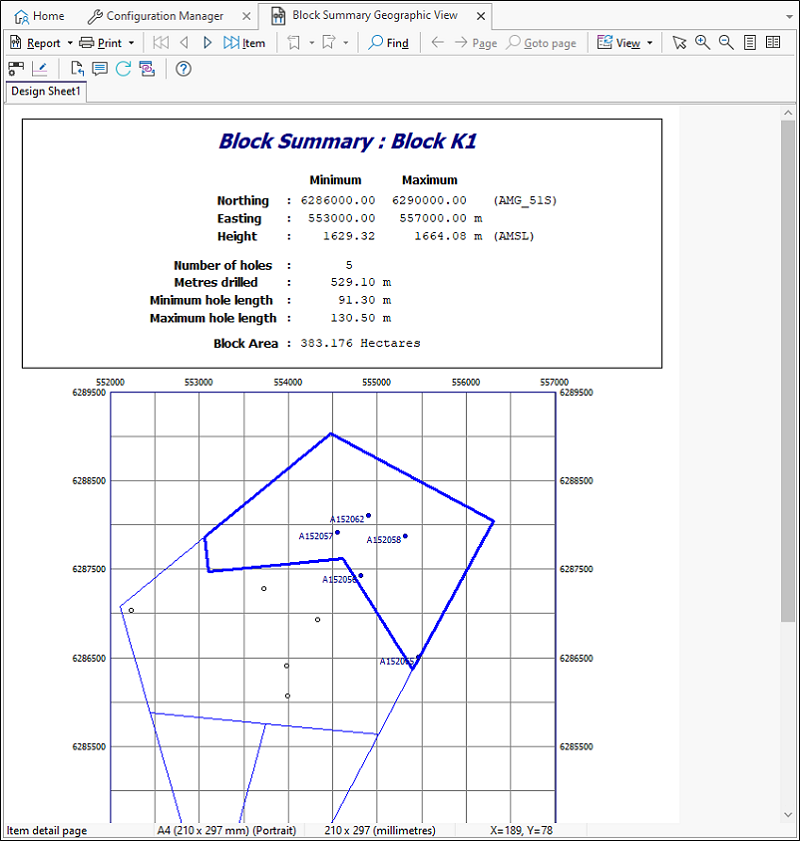
To connect a data view to a drillhole report, in the Graphic Reports module, Execute the report - for example the Block Summary Geographic View report - and select the relevant Project.

To enable the connection, click the Connector  button in the report toolbar.
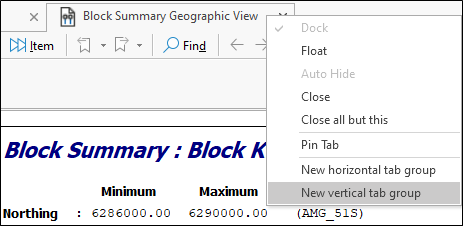
In order to execute the data view side-by-side with the report, right click on the report window tab and select New Vertical Tab Group.

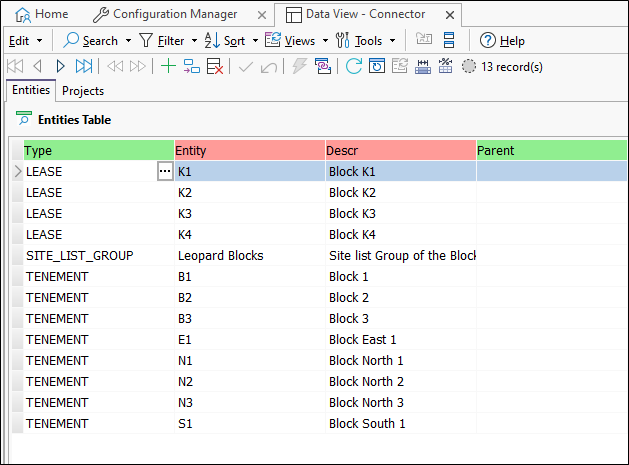
In the new tab group that is opened, execute the data view from the Data Views module. In this example, the data view contains the Project and Entity values for drillholes on the system.

Ensure that the Connector button is selected in the toolbar.
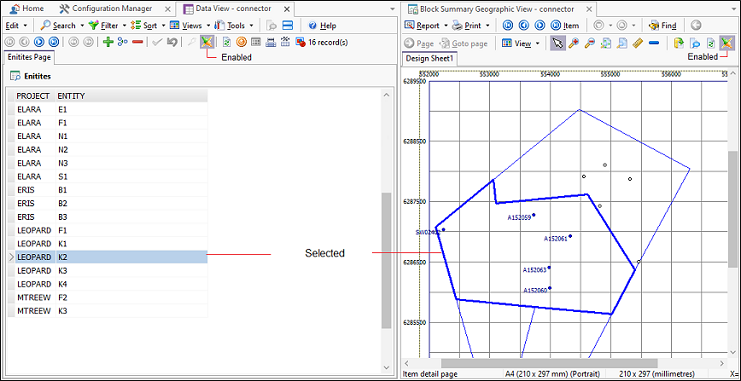
The following illustrates an example of the data view, connected to the Block Summary Geographic View report.

With the connection enabled, when you click an Entity in the data view, the corresponding boundary in the report will be highlighted.