Section Column Property Editor
Use the Configuration page of the Section Column Property Editor, to configure the columns that will be available for display in a section.
Data
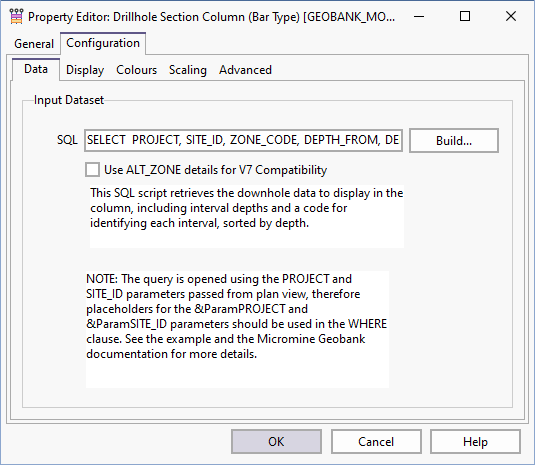
On the Configuration | Data page of the Section Column Property Editor, click the Build... button to load or create a customised SQL query to retrieve the collar coordinates of the drillholes you wish to display.
When you create a new section, Micromine Geobank will provide an example query based on the standard Micromine Geobank database model. The SQL Editor displays the SQL as well as a list of standard column names required by this process.
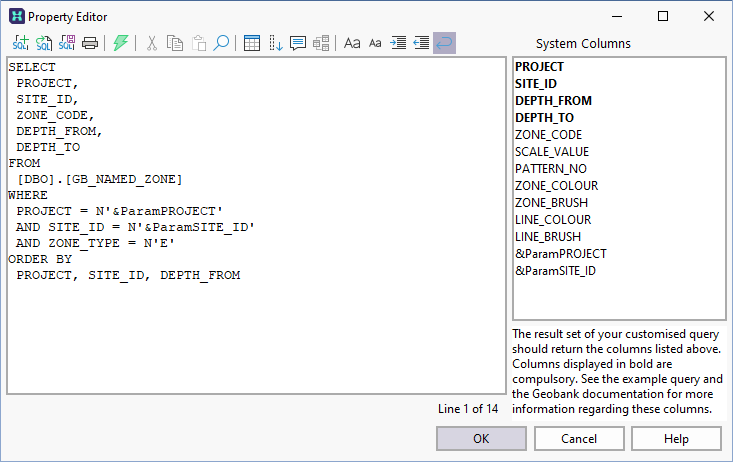
The SQL script retrieves the downhole data to display in the column, including interval depths and a code for identifying each interval, sorted by depth.
The query is opened using the PROJECT and SITE_ID parameters passed from the plan view, therefore placeholders for the &ParamsPROJECT and &ParamSITE_ID parameters should be used in the WHERE clause.
Display
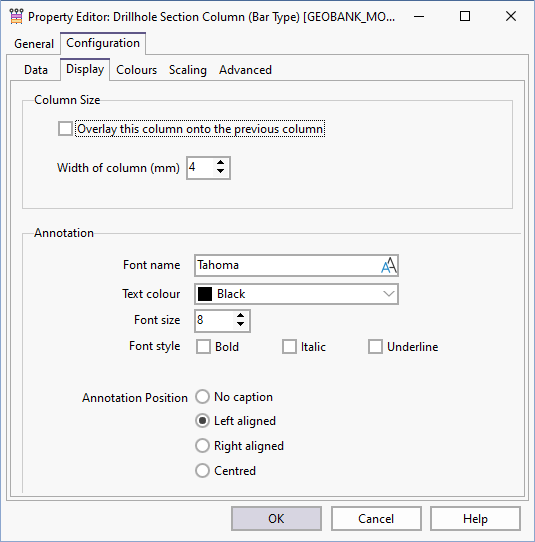
On the Configuration | Display page, set display options for the columns in the section view.
Column Size
Choose whether to Overlay this column onto the previous column, set the width of the column, and select the font style, font size, and font colour settings to be used for the scale bar annotation.
Annotation Alignment
Choose whether to Annotate the columns and on which side of the column or centred.
Text Font
Set the Font characteristics of the annotated text.
Colours
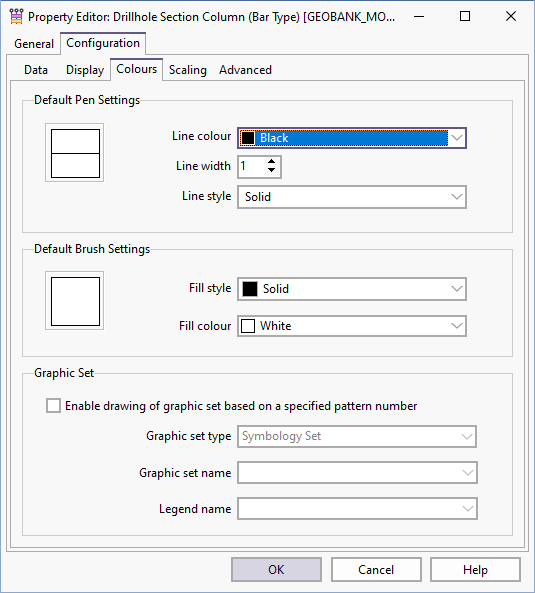
In the Configuration | Colours page, set the pen and brush colour and style options. A preview icon is displayed to the right of the colour, width, and style input boxes.
Default Pen Settings
The pen colour is the colour used to draw the border and other lines making up the column. The pen style is the line style (solid, dot, dash etc.) and width used to draw the border and other lines making up the column.
Only solid lines are supported for line widths greater than 1.
Default Brush Settings
Set the brush (fill) colour and style options. The brush colour is the colour used to render the background of the template. The fill style is the hatch or stipple used for the background.
When setting DEFAULT_BRUSH (style) properties in the code, the following (integer only) enumerations can be used:
bsSolid = 0
bsClear = 1
bsHorizontal = 2
bsVertical = 3
bsFDiagonal = 4
bsBDiagonal = 5
bsCross = 6
bsDiagCross = 7
When setting the DEFAULT_COLOUR (fill) properties in the code, the following formula can be used to calculate an integer, where R, G and B represent the 0-255 values for these colours. The formula is:
R + G*256 + B*65536
For example:
Red is 255 + 0*256 + 0*65536  = 255
Blue is 0 + 0*256 + 255*65536 = 16711680
Graphic Set
Symbology settings apply to the Bar Type column ONLY.
Symbology Sets and Colour Sets are managed under the Graphic Sets node of the Micromine Geobank User Interface tree, and can be referenced by other display objects, such as the columns in the Depth Adjustment window.
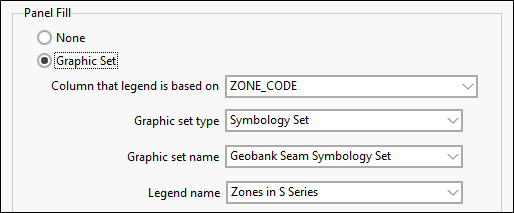
Graphic Set
Select this option if you want to use an optional PATTERN_NO column to associate a hatch pattern with the code returned in the CODE column. This pattern number must be compatible with the nominated symbology set and legend.
Select the Column that legend is based on, the symbology set for Graphic set type and Graphic set name, and an associated Legend.
Scaled Image
Select this option if you want to use a scaled image to hatch the panel.
Select the field to be used for the image information from the Image Source drop down.
Because the Depth Adjust display has a vertical-only zoom, you can select the Auto-rotate image check box to show core tray images in a meaningful way as zoom is adjusted – the image will be automatically rotated with the orientation of the panel.
Select the Lock aspect ratio check box to maintain the aspect ratio of the Width and Height properties for the scaled image in order to prevent distortion.

Scaling
On the Configuration | Scaling page, configure the scale bar for the column. A horizontal scale bar is required for a Graph type column, but is optional for a Bar type column.
The display range for the horizontal scale bar is determined by the Minimum and Maximum values you enter.
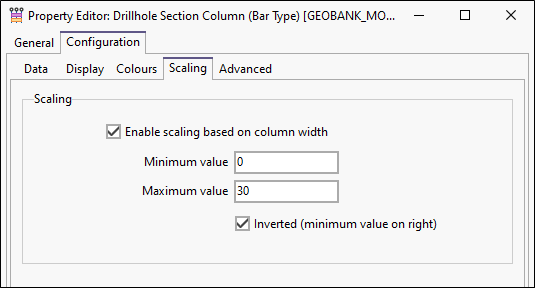
Select the Inverted option if you want the maximum value to appear on the left end of the bar.
Advanced
On the Configuration | Advanced page, a number of options can be applied to the section column you are configuring.
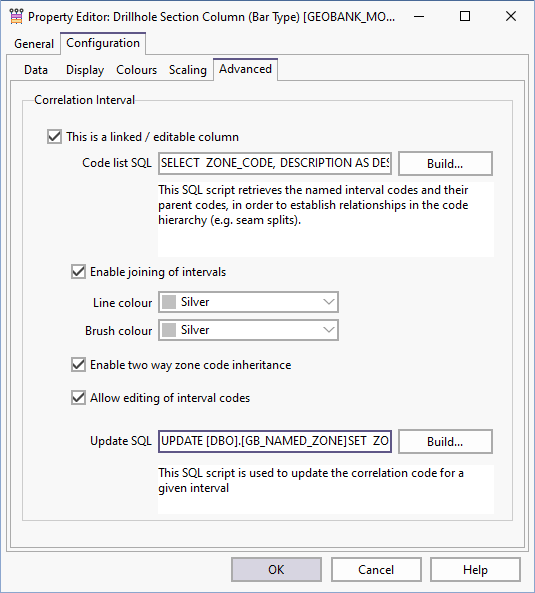
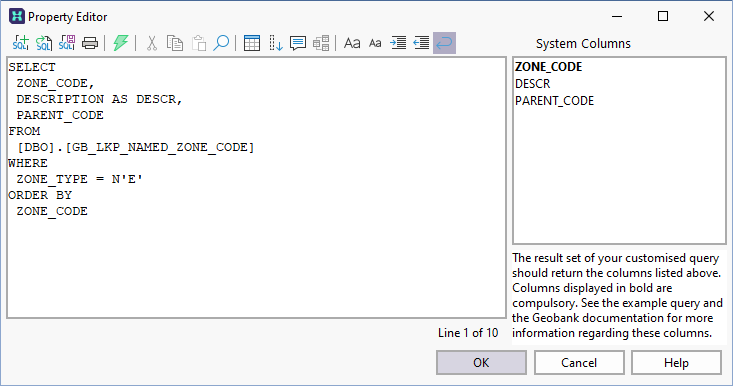
This column represents a named interval
The script retrieves the named interval codes and their parent codes, in order to establish relationships in the code.
Enable automatic joining of intervals
Select this option to generate join lines between zones and select the Line and Brush colours that will be used to draw the join lines between zones.
Enable two way zone code inheritance
By default, parent-child zone code inheritance is checked and rendered from left to right. Select this option to ensure that zones are linked from parent to child and from child to parent, in both directions.
Allow editing of interval codes
The section view can optionally be used to make changes to the downhole data. The SQL needed to perform these changes is defined on the Configuration | Advanced page.
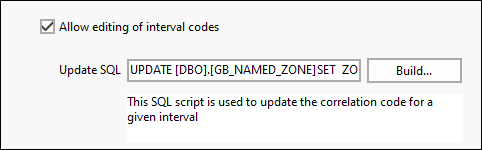
The update query you define is critical to the success of the database update process; therefore the SQL syntax should be carefully tested to ensure that it delivers the desired result.
The example query shown below is based on the GB_NAMED_ZONE table. Since this dataset is opened as a detail of the downhole dataset, it must contain the appropriate parameterised links.
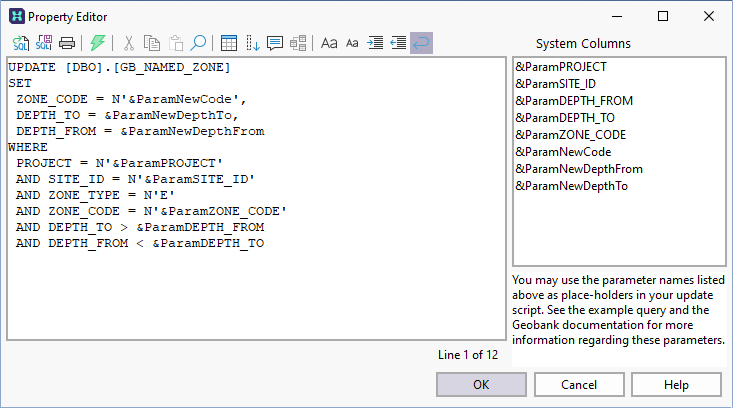
The example query uses values from the current downhole record to ensure that it will be updating the correct record in the database table. The new zone code is obtained by way of a substitution parameter, which must be pre-configured to allow the user to select the code from a drop-down list.