Wash Curve Display
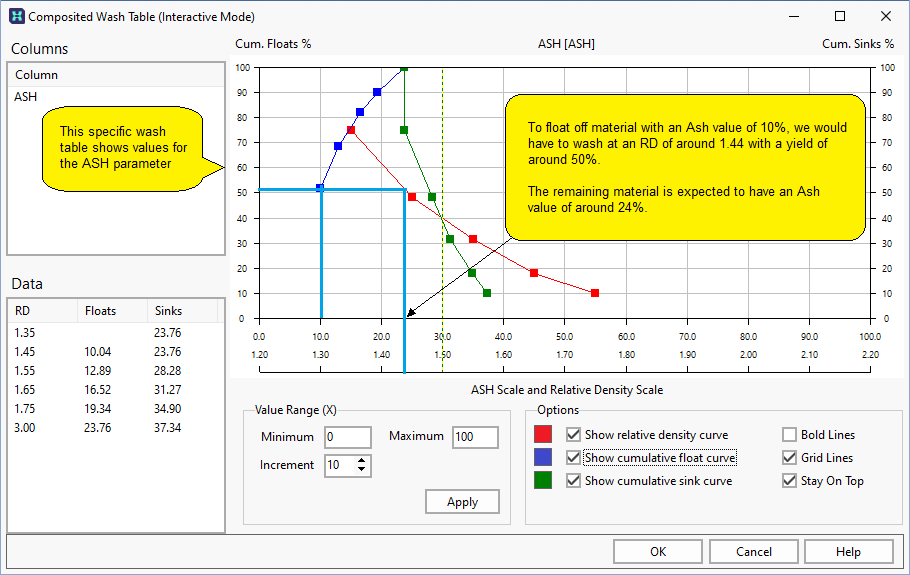
The Wash Curve Display shows the relative density and cumulative float curves for a specific zone. The display provides a number of information panes and display settings.
Columns
Relative densities and cumulative float values are listed for the quality parameter currently selected in the Columns pane. These values are plotted as separate curves in the wash curve display window.
Value Range (X)
Using the options in the Value Range (x) section, you can adjust the range of values (and how they are incremented) on the X axis. Set the Minimum and Maximum values, as well as the required Increment and click Apply.
Display options
You can display any or all of the curves (relative density, cumulative float, cumulative sink), display Grid Lines and Bold Lines.
If the Stay On Top option is selected, you can keep the Wash Curve display open while you use the Next Zone button on the Composite Wash Table form to scroll through the sample records.
The curves that are displayed in the wash curve viewer are drawn with simple straight line segments between sample points, giving them an angular appearance. However, the system uses smoothed cubic splines for interpolation.
Reading a Wash Table

Application
Information derived from wash tables can be used to:
- provide a basis for the initial assessment of the resource potential of coal deposits, by establishing theoretical estimates of beneficiation attainable by washing
- determine optimal process parameters by comparing theoretical results from various simulations
- assist in the design of coal preparation plants